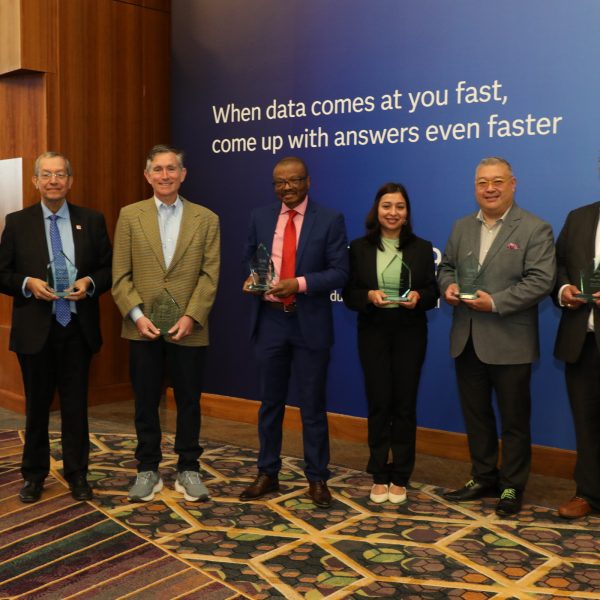
Last week, as part of an article on how spammers generate comments for blogs, I showed how to generate random messages by using the CATX function in the DATA step. In that example, the strings were scalar quantities, but you can also concatenate vectors of strings in the SAS/IML language.
English
What if you could rank where you stand versus your industry peers when it comes to how effectively you're making use of your data through analytics? Now you can. Jim Davis, Senior Vice President and Chief Marketing Officer at SAS, outlined an eight-metric test at today’s Premier Business Leadership Series
The US health care industry is always getting a bad rap. It takes heat for being too expensive or not efficient enough or just too complicated. We know we need it, and that living long and healthy lives requires it. But we also know we love to complain about it
Madison Avenue has a new phrase to describe the things they are trying to sell to us: artisan crafted. These days, there are artisan crafted breads and rolls, artisan crafted beers, artisan crafted coffees, artisan crafted soaps, and a host of other artisan crafted products. Artisan crafted seems to have
Why do people have 12 pairs of shoes and no health insurance? - Perhaps the consumer price index data can help explain it ... Great minds think alike - I recently saw a plot of the Consumer Price Index (CPI) data that Layne Ainsworth had created, and it reminded me
This SAS tutorial video will show you how to generate plots for two continuous numeric variables with Base SAS. Basic scatter plots, linear or curvilinear regression lines, confidence intervals or ellipses, and multiple plot overlays are demonstrated. To learn more about this topic, check out our SAS Programming 1: Essentials
It was just a couple of years ago that folks were skeptical about the term "data scientist". It seemed like a simple re-branding of an established job role that carried titles such as "business analyst", "data manager", or "reporting specialist". But today, it seems that the definition of the "Data
In my recent post on how to understand character vectors in SAS/IML, I left out an important topic: How can you allocate a character vector of a specified length? In this article, "length" means the maximum number of characters in an element, not the number of elements in a vector.
In my previous post in the Ask the Statistician interview series, we heard from statisticians at the Analytics 2013 conference discuss the how their statistical results are put into action within their organizations. Now let’s learn more about their specific examples of success they have had utilizing these results. Check out
Can the selection of the axis range in a graph influence how you perceive the data? Let's find out with a "Labor Participation Rate" graph ... Medical doctors have traditionally taken the Hippocratic Oath, swearing to practice medicine honestly. I have often thought that people creating graphs should swear a
It’s an understatement to say there are many Base SAS procedures! Some procedures may be used for basic report writing. Other procedures may be used to perform statistical analysis. Some have similar functions. Others are unique in the output that they can produce. Which procedure you choose generally depends on
An epic clash across the continent of Europe Every year since 1956 the nations of Europe (and now beyond) have come together to decide who has the best popular song. The contest has launched the careers of many global pop stars, most notably the unforgettable Swedish foursome, ABBA. No one
I'm currently working on a large project for a SAS customer. The project comprises many activities and phases, so there is a need to track progress on many different levels. During a recent meeting the project manager announced, "I'm putting together a status deck, and I'll include some Harvey Balls
Many years ago I was a SAS administrator for both a UNIX server and a LINUX server. I had a lot of syntax memorized and a lot of commands at my fingertips. If I ever mis-typed a command, I’d have to try again. I remember writing plenty of batch scripts
Last week Chris Hemedinger posted an article about spam that is sent to SAS blogs and discussed how anti-spam software helps to block spam. No algorithm can be 100% accurate at distinguishing spam from valid comments because of the inherent trade-off between specificity and sensitivity in any statistical test. Therefore,
All my friends seem to be having twins these days (below is a picture of my friend Holly's twins, for example) - I wondered if I could use SAS to analyze this twinning trend ... When I was growing up, way back in the day, twins seemed to be rarity.
All Analytics spoke with several leaders at the recent SAS Global Forum Executive Conference on what it means to build an analytics culture. Here’s a video of those conversations. The video features several sections related to building an analytics culture: Kim Nevala, Director of Business Strategy for the SAS Best
Which would you rather see - a table of numbers, or a nice graph? When it comes to unemployment numbers, I vote for the graph! The Bureau of Labor Statistics (BLS) provides several tables of data about the U.S. workforce. One such table (Table A-15) provides several different alternative measures
SAS programmers are probably familiar with how SAS stores a character variable in a data set, but how is a character vector stored in the SAS/IML language? Recall that a character variable is stored by using a fixed-width storage structure. In the SAS DATA step, the maximum number of characters
I'm an avid Star Wars fan, and am cautiously optimistic about what J.J. Abrams intends to do in Star Wars VII. The cast for the movie was revealed earlier this week, and today is May the Fourth, an unofficial Star Wars holiday. You might be asking yourself what any of
SG Procedures and GTL provide you with a large set of plot statements, such as BarChart, ScatterPlot, BoxPlot and more. You can use them for the intended purpose, and all is well and good. However, the real fun starts when you leverage a plot to do something that was not
My oldest son is in the school band, and they are getting ready for their spring concert. Their fall concert was wonderful; hearing dozens of students with their specific instruments playing together creates beautiful, rich sounding music. The depth of sound from orchestral or symphonic music is unmatched. In data
As I was preparing for a customer introduction to using SAS Enterprise Guide, I asked them to send me all the questions they had regarding the Enterprise Guide usage. It turned out that many of their questions can be answered with a single feature called an autoexec, or automatically executable
As we saw in Steve Morlidge's study of forecast quality in the supply chain (Part 1, Part 2), 52% of the forecasts in his sample were worse than a naive (random walk) forecast. This meant that over half the time, these companies would have been better off doing nothing and
Instead of using a crystal ball to find out what the future holds for analytics, I decided to do something even better -- ask Udo Sglavo, SAS Forecasting R&D director. Sglavo breaks down the benefits of two new SAS analytical clients, SAS Enterprise Miner and SAS Forecast Server in this
When I worked for SAS Italy, I was considered an old SAS employee because I started with SAS 8, and I saw all SAS 9 innovations from the beginning. I can even remember using SAS 6.12 a couple of times! Then I moved to the US and I felt like
While at a conference recently, I was asked whether it was possible to use SAS to simulate data from an inverse gamma distribution. The SAS customer had looked at the documentation for the RAND function and did not see "inverse gamma" listed among the possible choices. The answer is "yes."
With tornadoes in the news lately, I wondered how I might could use SAS to analyze tornado data. How about animating 60 years of tornado path data? ... I was using Google to search for ways to analyze tornado data, and found an example on ustornadoes.com that animates the tornado
I led an analytical culture track at the SAS Global Forum Executive Conference last month in Washington, DC. I talked with leaders in fields as diverse as healthcare, chemical manufacturing and government. Although these organizations have very different operating models, their challenges, comments and questions were similar. They all recognized