Im Rahmen meiner Tätigkeit im Vertrieb von Compliance-Software-Lösungen bin ich hauptsächlich im Bankensegment unterwegs, zunehmend aber auch bei Versicherungen. Dank kluger CRM-Systeme wird mir bewusst gemacht, dass ich in acht Jahren etwa 1.600 Gespräche mit den Verantwortlichen für Geldwäsche- und Betrugsprävention geführt habe. Das ist unfassbar. Wir „Vertriebler“ produzieren zwar
Uncategorized
The BFD on RFPs Software selection teams are prone to issuing lengthy requests for information (RFIs) or requests for proposals (RFPs), with page after page of check boxes for so-called requirements. Vendors stay in contention by dutifully checking off each box as either “available now,” “available in next release,” or
3월 라스베이거스에서 전 세계 4만명 이상의 헬스케어 IT 전문가, 임상의, 기업 경영진 등이 참여한 가운데 세계적인 헬스케어 IT 컨퍼런스 ‘HIMSS (Healthcare Information and Management Systems Society)’가 개최됐습니다. 기조연설을 맡은 에릭 슈미트(Eric Schmidt) 전 구글 CEO는 인간 중심 의료(person-centered care)의 중요성에 대해 역설하며 주목 받았는데요. 이어 무대에 오른 시마 버마(Seema Verma) 미국 의료서비스센터(CMS)
When you realize your organization has a forecasting problem, what do you do to solve it? In particular, if you realize you need new forecasting software, how do you begin to find it? All too often, the first step in a software selection process is the Request for Proposal (RFP)
Have you ever tried to plot data on a map of Antarctica ... and been thoroughly frustrated or confused? If you're that person, or even a seasoned map maker wanting to hone your skills, then this blog post is for you! But first, here is a picture to get you
Customer Experience entscheidet über den Geschäftserfolg – und zwar in jeder Branche. Für Unternehmen, die das verstanden haben, ergibt sich der Rest wie von selbst. Das positive Kundenerlebnis sollte immer im Fokus stehen, denn es ist die Bedingung für Kundentreue und -bindung – und kann letztlich den Umsatz erhöhen. Der
Ich sehe es vor meinem geistigen Auge … … den Head of Customer Experience, wie er mir das mit seinem treusten Blick entgegnet, als ich leicht aufbegehrte, dass ich auch beim 385. Mal keinen neuen Kredit oder Auslandsreiseversicherung oder, oder, oder kaufen wollte … Strategieberater sind sich einig: Customer Experience
치타가 멸종 위기 동물이라는 사실, 알고 계셨나요? 치타의 개체 수는 지난 세기 동안 93% 감소했습니다. 또 치타는 기존 아프리카 서식지의 76%에서 더 이상 발견되지 않습니다. 분석과 인공지능(AI)으로 치타와 같이 멸종 위기에 처한 동물을 보호할 수 있다면? 그리고 그 과정에 여러분 모두가 참여할 수 있다면 어떨까요? 동물 보호 비영리 단체 와일드트랙(WildTrack)은 발자국과 클라우드소싱에서
Poverty. It's a bit difficult to define who lives in poverty - I guess it's a relative thing, and depends on the standard of living of the people around you. Today we're going to take a look at the child poverty rates in several 'rich' countries (such as the United
In this first of two posts, Phil Simon chimes in on the prospect of data protection regulation in the US.
SAS author Jane Eslinger shows give you tips for working with PROC TEMPLATE when diving into the Output Delivery System (ODS) world. Learn how to create a custom style template to get the stylized output you want.
In August 2017, Britta Gross spoke about General Motors’ perspective on bringing electric vehicles (and their derivatives) to market. Her point of view reaffirmed GM's research on consumer awareness of electric vehicles (only 60 percent) and consumer adoption concerns with this emerging technology. She also revealed the portfolio of cars
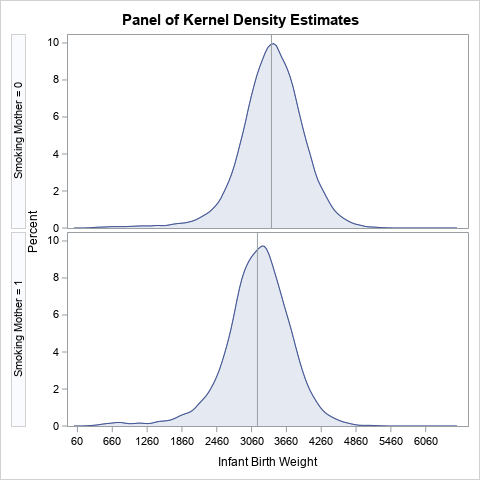
This article shows how to construct a butterfly plot in SAS. A butterfly plot (also called a butterfly chart) is a comparative bar chart or histogram that displays the distribution of a variable for two subpopulations. A butterfly plot for the cholesterol readings of 5,057 patients in a medical study
Amor e matemática. Quase não se consegue imaginar dois mundos mais afastados. No entanto Hannah Fry provou que as matemáticas podem descobrir o segredo de um relacionamento bem-sucedido e prever um divórcio. Conversámos com a professora da UCL e perguntámos sobre a relação que os humanos têm com as novas
Andy Dufresne, the wrongly convicted character in The Shawshank Redemption, provocatively asks the prison guard early in the film: “Do you trust your wife?” It’s a dead serious question regarding avoiding taxes on a recent financial windfall that had come the guard's way, and leads to events that eventually win
You can still register for the 38th annual International Symposium on Forecasting, being held June 17-20 in Boulder, Colorado, at the foothills of the Rockies. Beyond the daily keynotes and over 150 presentations of new research, a separate Practitioner Track features talks on the application of forecasting research to organizational
In a recent blog post, Chris Hemedinger used a scatter plot to show the result of 100 coin tosses. Chris arranged the 100 results in a 10 x 10 grid, where the first 10 results were shown on the first row, the second 10 were shown on the second row, and so
SASでは、従来からSAS Viyaの機能をPythonなど各種汎用プログラミング言語から利用するためのパッケージであるSWATを提供していました。 これに加え、よりハイレベルなPython向けAPIパッケージであるDLPyの提供も開始され、PythonからViyaの機能をより効率的に活用することが可能となっています。 ※DLPyの詳細に関しては以下サイトをご覧ください。 https://github.com/sassoftware/python-dlpy DLPyとは DLPyの機能(一部抜粋) 1.DLPyとは DLPyは、Viya3.3以降のディープラーニングと画像処理(image action set)のために作成された、Python API向けハイレベルパッケージです。DLPyではKerasに似たAPIを提供し、ディープラーニングと画像処理のコーディングの効率化が図られています。既存のKerasのコードをほんの少し書き換えるだけで、SAS Viya上でその処理を実行させることも可能になります。 例えば、以下はCNNの層の定義例です。Kerasに酷似していることがわかります。 DLPyでサポートしているレイヤは、InputLayer, Conv2d, Pooling, Dense, Recurrent, BN, Res, Proj, OutputLayer、です。 以下は学習時の記述例です。 2.DLPyの機能(一部抜粋) 複数のイルカとキリンの画像をCNNによって学習し、そのモデルにテスト画像を当てはめて予測する内容を例に、DLPyの機能(一部抜粋)を紹介します。 2-1.メジャーなディープラーニング・ネットワークの実装 DLPyでは、事前に構築された以下のディープラーニングモデルを提供しています。 VGG11/13/16/19、 ResNet34/50/101/152、 wide_resnet、 dense_net また、以下のモデルでは、ImageNetのデータを使用した事前学習済みのweightsも提供(このweightsは転移学習によって独自のタスクに利用可能)しています。 VGG16、VGG19、ResNet50、ResNet101、ResNet152 以下は、ResNet50の事前学習済みのweightsを転移している例です。 2-2.CNNの判断根拠情報 heat_map_analysis()メソッドを使用し、画像の何処に着目したのかをカラフルなヒートマップとして出力し、確認することができます。 また、get_feature_maps()メソッドを使用し、CNNの各層の特徴マップ(feature map)を取得し、feature_maps.display()メソッドを使用し、取得されたfeature mapの層を指定して表示し、確認することもできます。 以下は、レイヤー1のfeature mapの出力結果です。 以下は、レイヤー18のfeature mapの出力結果です。 2-3.ディープラーニング&画像処理関連タスク支援機能 2-3-1.resize()メソッド:画像データのリサイズ 2-3-2.as_patches()メソッド:画像データ拡張(元画像からパッチを生成) 2-3-3.two_way_split()メソッド:データ分割(学習、テスト) 2-3-4.plot_network()メソッド:定義したディープラーニングの層(ネットワーク)の構造をグラフィカルな図として描画 2-3-5.plot_training_history()メソッド:反復学習の履歴表示
前回の「ディープラーニングの判断根拠」ブログでは、PythonからSAS Viyaの機能を活用するためのパッケージであるSWATを使用した例を説明しましたが、今回は、以下2点に関してご紹介します。 SAS ViyaのよりハイレベルなPython APIであるDLPyを使用した画像認識モデルの判断根拠情報 機械学習の判断根拠情報 1.SAS ViyaのよりハイレベルなPython APIであるDLPyを使用した画像認識モデルの判断根拠情報 この例では、複数のイルカとキリンの画像をSAS Viyaのディープラーニング(CNN)で学習させ、そのモデルに以下の画像を当てはめて、これがイルカなのか否かを判別するものです。 実際、この画像はイルカであると判定されたんですが。 SAS Viyaでは、その判断根拠となり得る情報の一つとして、入力画像のどこに着目したのかを以下の通り出力し、確認できるようになっています。 DLPyでは、get_feature_maps()メソッドでfeature mapを取得し、feature_map.display()で指定したレイヤーの内容を表示することができます。 以下は、レイヤー1のfeature mapです。 以下は、レイヤー18のfeature mapです。 白色の濃淡で、判別に影響を与えている箇所を確認することができます。 さらに、SAS Viyaでは、画像認識モデルの判断根拠情報を可視化する手法の一つである、Grad-CAMと同様に、画像の何処に着目したのかを、カラフルなヒートマップとして出力し、確認することもできるようになっています。 しかも、heat_map_analysis()メソッドを使用して、以下の通り、たった1行書くだけでです。 青、緑、赤の濃淡で、判別に影響を与えている箇所を確認することができます。 DLPyの詳細に関しては、以下をご覧ください。 https://github.com/sassoftware/python-dlpy 2.機械学習の判断根拠情報 もちろんディープラーニングだけではなく、従来からの機械学習のモデルによって導き出された予測や判断に関しても、それがなぜ正しいと言えるのか、具体的に言えば、なぜAさんはこの商品を買ってくれそうだと判断されたのか、なぜこの取引データは疑わしいと判断されたのか、を説明する必要性があるわけです。特に説明責任が求められるような業務要件においては、 ということでSAS Viyaの次期版には機械学習の判断根拠情報、モデル内容を説明するための機能が実装される予定です。 まず、影響度が最も高い変数は、という問いに対しては、従来からの変数の重要度で確認することができます。これをさらに一段掘り下げたものが、Partial Dependence (PD)です。 日本語では「部分従属」と言いますが。重要度の高い変数は、予測に対して、具体的にはどのように作用しているのかを知ることができます。 そしてこのPDを元にさらに一段掘り下げたものが、Individual Conditional Expectation (ICE)になります。 また、これらとは別に、なぜその予測結果に至ったのかを説明するテクニックとしてLocal Interpretable Model-agnostic Explanations (LIME)を活用することができます。 SAS Viyaベースの製品であるSAS Visual Data Mining and
SAS 솔루션으로 다양한 종류의 심층 신경망(DNN;Deep Neural Network) 모델을 구축할 수 있습니다. 구체적으로 컨볼루션 신경망(convolutional neural networks), 순환 신경망(recurrent neural networks), 순방향 신경망(feedforward neural networks), 오토인코더 신경망(autoencoder neural networks) 등을 생성할 수 있는데요. 오늘은 ‘SAS VDMML(Visual Data Mining and Machine Learning)'을 이용해 딥러닝 모델을 구축하는 방법을 자세히 설명해 드리고자 합니다. ‘SAS 클라우드 분석 서비스’를 활용한 딥러닝
Editor-in-Chief Len Tashman's Preview of Foresight The Spring 2018 issue of Foresight—the 49th since our beginning in 2005—opens with a feature section on Supply Chain forecasting. More specifically, it addresses the very critical matter of how a company should determine its service-level targets, or the probability that no shortages occur between the time
During SAS Global Forum 2018, I sat down with four SAS users to get their take on what makes a SAS user. Read through to find valuable tips they shared and up your SAS game. I’m sure you will come away inspired, as you discover some universal commonalities in being a SAS user.
We all are now learning to live with the EU’s General Data Protection Regulation. It has often been viewed as a challenge and a requirement, a box that needs to be ticked before everyone can get on with doing their day jobs again. Recently, however, I have noticed a slight change
Stigma and discrimination in behavioral health, while improving, remain obstacles to people seeking care. And any obstacles need to be addressed, because those struggling with behavioral health and mental illness are simply not getting the help they need. According to the National Institute of Mental Health, “The percentage of young
Don't be a data hoarder. Jim Harris shares guidelines for a data retention strategy.
Part 6 of this series takes us to the first Dutch SAS partner, PW Consulting, where I talked with Technical Director Willem Boersma, Data Scientist Wouter Hordijk and Sales Manager Jeroen de Nooijer. Company overview PW Consulting was founded in 1988, one year after SAS Netherlands opened. For those who
15일 삼성동 코엑스 인터컨티넨탈 호텔에서 SAS 고객, 파트너, 산업별 전문가 650여명이 참석한 가운데 <SAS FORUM KOREA 2018>이 성황리에 개최됐습니다. 이번 포럼에서는 인공지능(AI), 머신러닝, 사물인터넷(IoT) 등 최신 기술을 활용한 고급 분석 전략과 다양한 비즈니스 혁신 사례가 논의됐는데요. 지금부터 그 현장의 하이라이트를 소개합니다! 먼저 오병준 SAS코리아 대표이사가 환영사를 통해 오늘날 애널리틱스 이코노미
In my article about how to construct calibration plots for logistic regression models in SAS, I mentioned that there are several popular variations of the calibration plot. The previous article showed how to construct a loess-based calibration curve. Austin and Steyerberg (2013) recommend the loess-based curve on the basis of
In a recent #SASchat we explored the intersection of artificial intelligence and human creativity. Posing questions like, "How is AI impacting human creativity?" And, "What will it take for the public to fully trust AI?" In the lively online conversation, a few themes prevailed: Automation enabled by AI frees humans
Im Gastbeitrag beschreibt Metacoda, wie die SAS Platform datenschutzkonform betrieben werden kann, und welche Tools dabei helfen. Sobald Unternehmen Kunden aus der Europäischen Union bedienen und deren persönliche Daten verarbeiten, muss zukünftig die Datenschutz-Grundverordnung, kurz DSGVO, eingehalten werden. Das sagt Ihnen nichts? Diese Grafik gibt einen ersten Überblick über die neue