Improving the detection of level shifts using the median filter

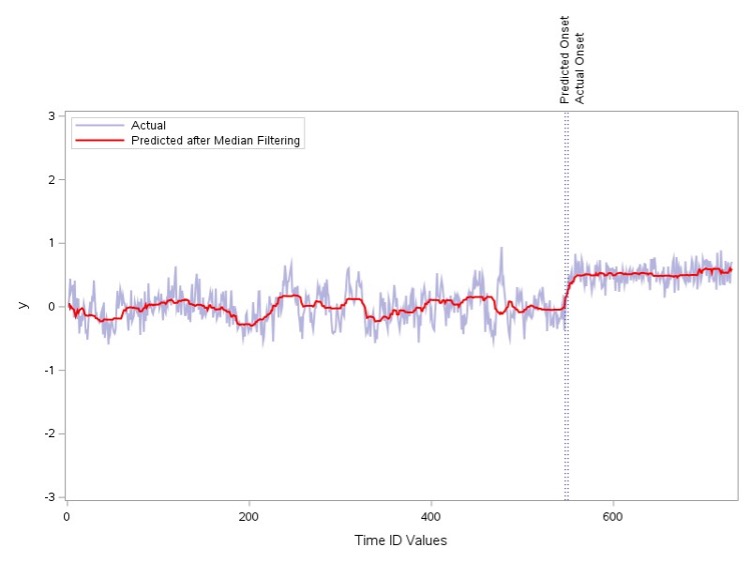
Time series data is widely used in various fields, such as finance, economics, and engineering. One of the key challenges when working with time series data is detecting level shifts. A level shift occurs when the time series’ mean and/or variance changes abruptly. These shifts can significantly impact the analysis and forecasting of the time series and must be detected and handled properly.