 Because you are already halfway there and you should want the entire process to be data-driven, not just the historical reporting and analysis. You are making decisions and using data to support those decisions, but you are leaving value on the table if the analytics don't carry through to forecasting. In the parlance of the domain, don't stop with just the descriptive analytics while neglecting the power of predictive and prescriptive analytics.
Descriptive analytics relies on the reporting and analysis of historical data to answer questions up until a particular moment in time. Using basic statistics such as mean, frequency and standard deviation, it can tell you what happened, how many, how often and where? With the application of additional statistical techniques such as classification, correlation and clustering, you end up with an explanatory power that can sometimes even tell you ‘Why’.
In the terminology I proposed in this earlier post, “The Skeptical CFO”, descriptive analytics covers the first two of my first four points: “Where am I right now”, and “What is my ability to execute”, the latter typically surfaced through a BI capability that computes and displays the historical data in the form of metrics for ease of standardization, comparison and visualization.
But why stop there? Why stop your data-driven approach to decision making at the halfway point, at the vertical bar in the above graphic?
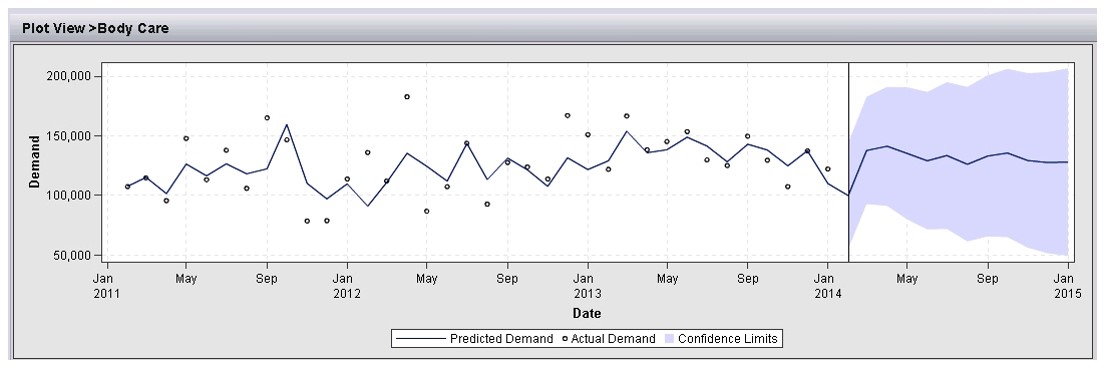
Your decisions are always about the future – what direction to take, where to invest, what course corrections to make, what markets to expand into, what and how much to produce, who to hire and where to put them. In other words, a forecast, the third of my four points, with the fourth being perhaps the most important of the lot - a confidence level or uncertainty measurement about that forecast, these last two coming from the realm of predictive analytics.
Even if you’re not comfortable using the statistical forecast straight out of the box, don’t you at least want to know what it indicates? What data-driven trends and seasonality it has on offer? And wouldn’t you appreciate having a ballpark estimate of the risk and the variability that is likely inherent in any forecasting decision?
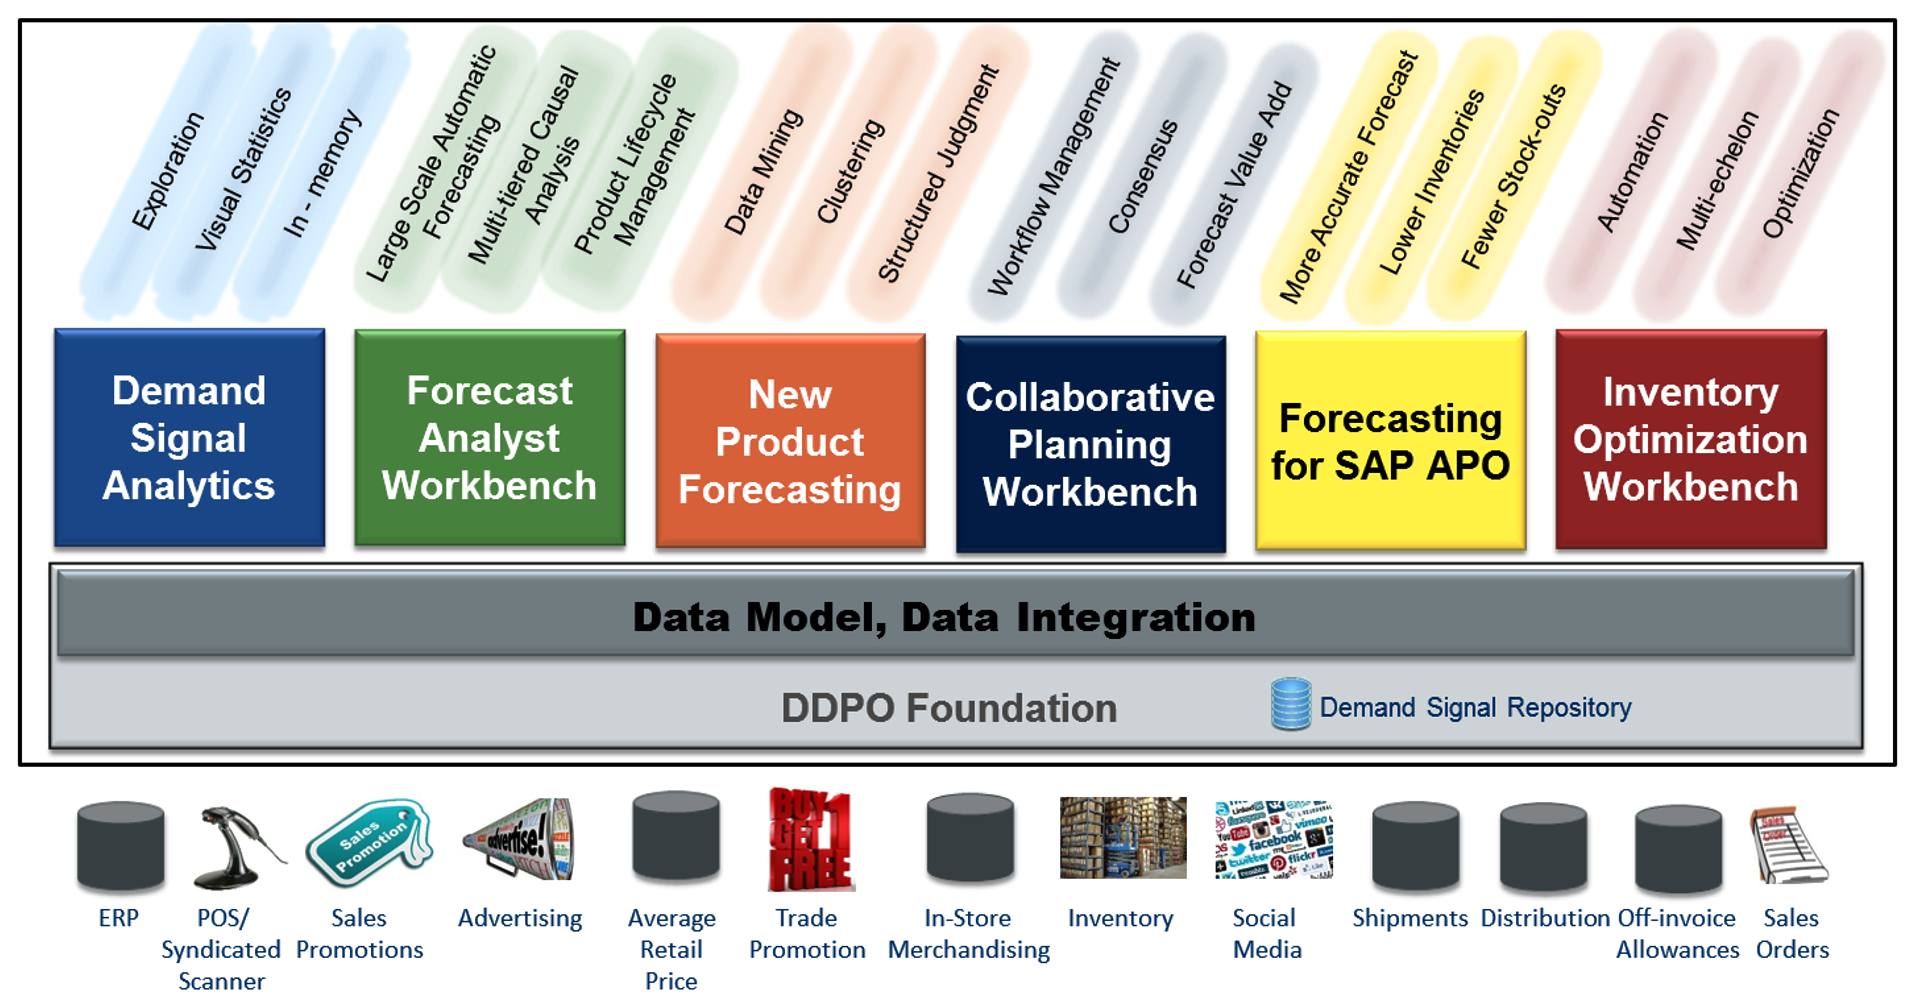
Getting back to that “straight out of the box” issue, the truth is, for roughly 80% of your detailed forecasting needs (depending of course on the quality of the data and the inherent forecastability of the item in question – see: “The beatings will continue until forecast accuracy improves”), the machine is going to be as or more accurate than you, and much, MUCH faster at it. The forecast analyst workbench listed below can generate incredibly high-volume forecasts at the detailed level (i.e. SKU, size, color, style, packaging, store, expense line item, cost center …) in short order, leaving the forecast analyst free to spend the bulk of their time improving on those hard-to-forecast exceptions.
Lest you doubt the veracity of my 80% (+/-) claim above, the collaborative planning workbench (below), in addition to facilitating the consensus forecast you would expect from its name, also includes a Forecast Value Add capability to identify and eliminate those touch points that are not adding value. You would be surprised at how many reviewers, approvers, adjustments, tweaks and overrides actually make the forecast worse instead of better (then again, maybe you wouldn’t).
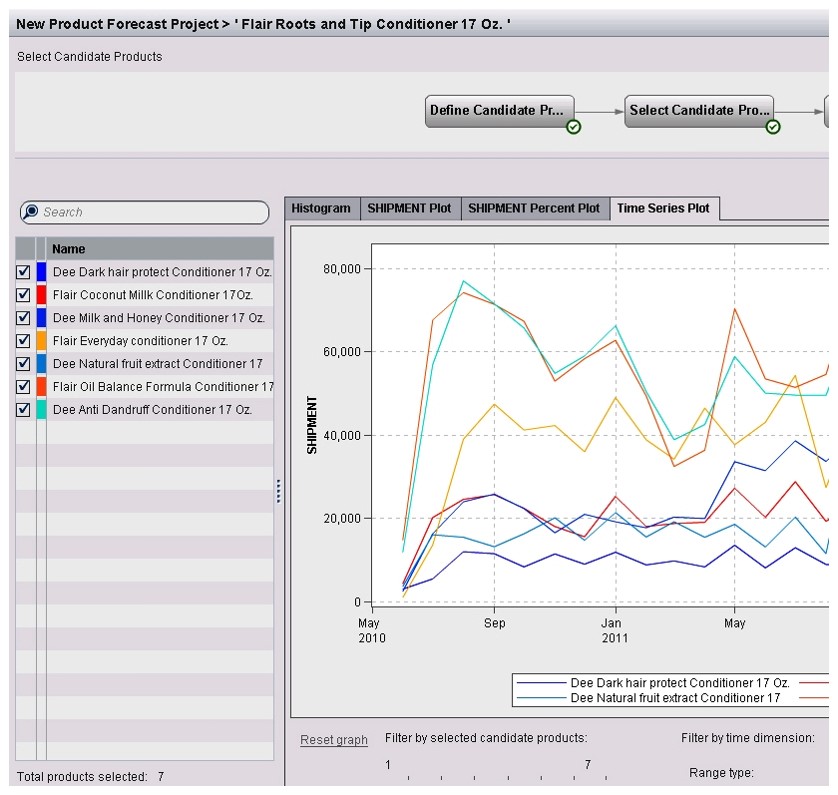
Can you be data-driven when it comes to new product forecasting? If you’ve got the structured judgment / analogy capability of the new product forecasting workbench then the answer is yes. It uses statistically determined candidate analogies or existing surrogate products with similar attributes to provide an objective basis for predicting new product demand.
Beyond predictive analytics, which provides answers to 'What if these trends continue', and 'What will happen next', lies prescriptive analytics – what SHOULD I do; what’s the best, or optimal, outcome? The inventory optimization workbench optimizes inventory levels across a multiechelon distribution chain based on constraining factors such as lead times, costs, and/or service levels. And just as with the forecasting component, 80% of the optimization can be automated, again leaving the inventory analyst free to focus on hard-to-plan or incomplete orders.
When you hear the word “optimization” in this context, think of two elements: a forecast, and a corresponding set of constraints. Knowing that context, you can see why SAS has taken this integrated workbench approach to demand-driven planning. A common foundation and data repository enables the consensus forecast, as well as collaboration between the forecast and inventory analysts. Even the purely descriptive component, the demand signal analytics workbench, is completely integrated with the same demand signal repository that will eventually build the forecast and the inventory plan.
When it comes to decision support, don’t settle for halfway. Because half of the value-add lies to the right of that vertical line. It all starts with the forecast, which drives the integrated business planning (IBP) process and is its largest source of variation and uncertainty. Improving the forecast will affect everything downstream. And, it can have a multiplier effect as it travels along the IBP process. Even slight forecasting improvements can have a larger proportional effect on revenue, costs, profit, customer satisfaction and working capital than any other factor – financial, supply-oriented, or otherwise.
Get the forecast right, and good things will follow.

2 Comments
Pingback: Why Analytic Software | EPM Channel
Pingback: Agile strategy, revisited - Value Alley