All Posts


Suppose you want a list of car manufacturers from the CARS dataset. Easy! Call the %CHARLIST macro from a %PUT statement, like this: The CHARLIST macro generates a list of unique values of a selected variable from a selected dataset. So does PROC FREQ. But, if you don't need statistics, the CHARLIST


현존 최고의 데이터 과학자들이 뽑은 머신러닝 알고리즘 개발 베스트 프랙티스! 그 대망의 마지막 시간입니다. 이전 블로그를 통해 다양한 유형의 모델을 결합하는 방법을 소개해드렸다면, 오늘은 다양한 유형의 데이터를 결합하고, 모델의 다양한 변수를 활용하는 방법에 대해 이야기하고자 합니다. 이전 시리즈를 놓치셨나요? 블로그 1탄, 블로그 2탄을 참고해주세요. 기본기 다지기 희귀한 이벤트 탐지하기 수많은 모델 결합하기 모델


The North Georgia Candy Roaster I’m a North Carolina native, born and raised. So, it was quite a surprise at a recent trip to the farmers market when I came across this odd looking, large pink banana-shaped pumpkin-squash that I had never laid eyes on. When I asked what it
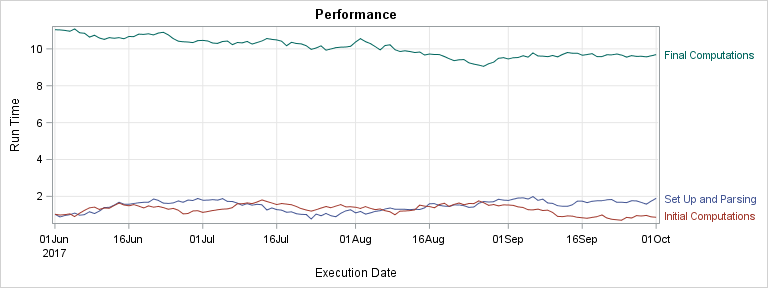

Curve labels in series plots can be positioned inside or outside the graph. Date variables can be specified as TYPE=LINEAR with a date format or more commonly as TYPE=DATE. Sometimes external curve labels might appear below or above the graph, particularly with TYPE=DATE axes. This post shows you ways to move them to the right of the graph.
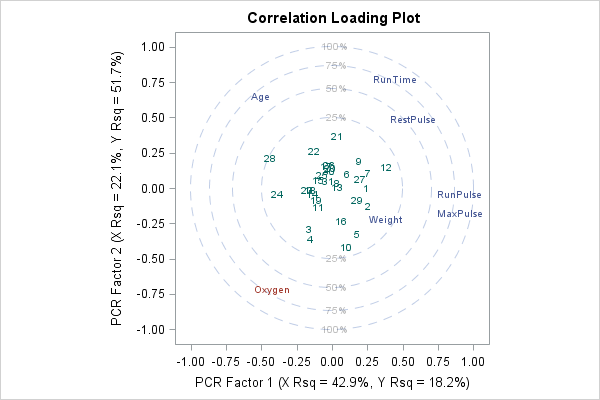

This article describes the advantages and disadvantages of principal component regression (PCR). This article also presents alternative techniques to PCR. In a previous article, I showed how to compute a principal component regression in SAS. Recall that principal component regression is a technique for handling near collinearities among the regression


Es claro que este año que está por finalizar ha traído grandes cambios para todo el mundo en cuanto a transformación digital se trata, se estructuraron cambios en las industrias, la economía e incluso las formas de comunicación con sus clientes. Pero la tecnología no se detiene y cada día
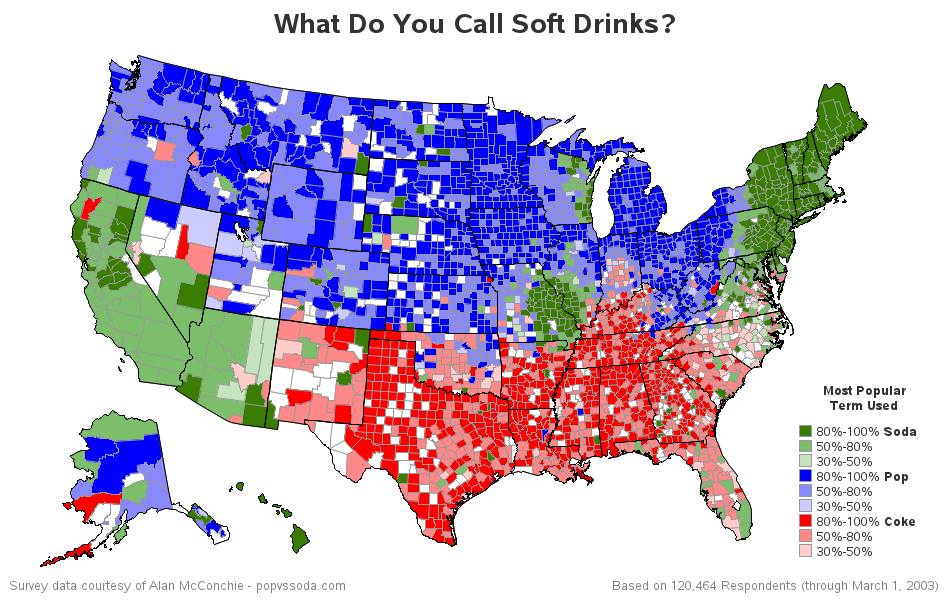

Quick Quiz! Where might you hear the following conversation? ... Waitress: "What would you like to drink, honey?" Customer: "I'll have a coke." Waitress: "What kind?" Customer: "Diet Pepsi." If you answered somewhere between Texas and Georgia, you would be correct! To those of us not from that area, it

Es claro que este año que está por finalizar ha traído grandes cambios para todo el mundo en cuanto a transformación digital se trata, se estructuraron cambios en las industrias, la economía e incluso las formas de comunicación con sus clientes. Pero la tecnología no se detiene y cada día que pasa


Kim Kaluba says start the journey toward ominchannel with a data strategy based on governance.


La industria financiera es la que más cambios genera al paso de los años. El registro de datos generaba confusión que conduce a una crisis dentro del sector. Hoy, la analítica crea una nueva vertiente para la correcta toma de decisiones. Un estudio reveló que los analistas dedicaban el 80 por ciento
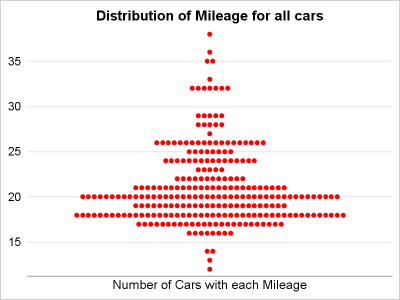

Last year, a user asked about creating a "Turnip Plot" as used in this study of Caesarian Section Rates. Primarily, this is similar to a histogram on the y-axis for each unique value on the y-axis. A marker is drawn for each occurrence, starting from the center. Back then, I
A common question on discussion forums is how to compute a principal component regression in SAS. One reason people give for wanting to run a principal component regression is that the explanatory variables in the model are highly correlated which each other, a condition known as multicollinearity. Although principal component
The previous post on Multiple Blank Categories showed how to include multiple blank categories on the axis. But, given the purpose for this was to separate different segments in the data, I also included ideas on how to segmented a discrete axis using reference lines or Block Plot. A similar idea


To make accurate predictions, it is necessary that the sample data you use for model development is compatible with the target population. The distribution of each input used in the model should be similar in the sample and the target population. In your model you should include only those variables


There are many compelling reasons existing SAS users might want to start integrating SAS Viya into their SAS9 programs and applications. For me, it comes down to ease-of-use, speed, and faster time-to-value. With the ability to traverse the (necessarily iterative) analytics lifecycle faster than before, we are now able to generate