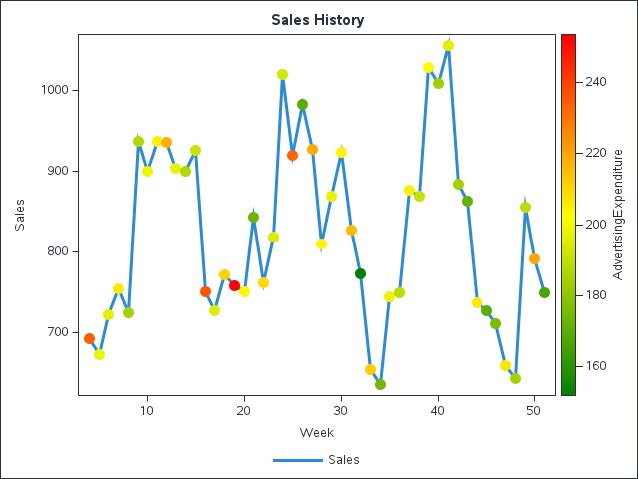
Get the latest machine learning algorithms and techniques
From slopes to stats: Building a snowboarding performance dashboard with Python and my own sensor data

Learn about how I used Python, SAS, GPS, and heart rate data to track and visualize my snowboarding performance.