This blog is a part of a series on the Data Science Pilot Action Set. In this blog, we introduce the action set and the actions for building data understanding.
Do you ever wish there was an easy button on data science? Do you ever think to yourself, "I want a solution that could examine the importance of missing variables, create new features, and build models with the best possible performance?" I am still looking for that easy button. However, the Data Science Pilot Action Set comes pretty close.
The Data Science Pilot Action Set
The Data Science Pilot Action Set is included with SAS Visual Data Mining and Machine Learning (VDMML) and consists of actions that implement a policy-based, configurable, and scalable approach to automating data science workflows. These actions allow you to move from a data set to a deployable model in a flash! There are seven actions in total on VDMML 8.4:
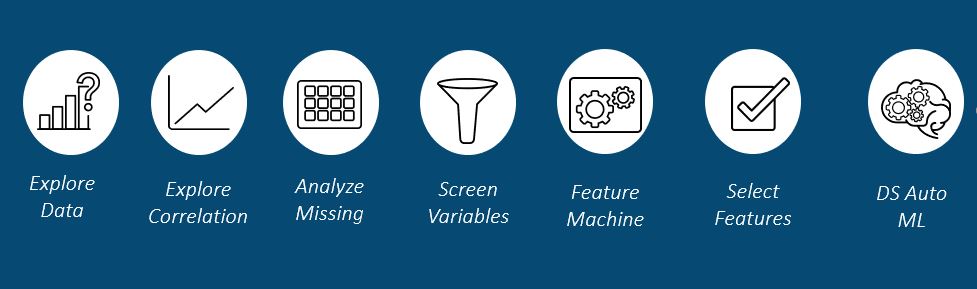
The first four actions help find data-quality issues in a complete and exploratory manner. The next two actions help generate and select model features. The final action creates a complete automated machine learning pipeline. In addition to the seven actions, there are four policies. These policies define rules for specific actions. In this post of my blog series, I will introduce the first four actions and their corresponding policies.
The exploreData action
The exploreData action automatically calculates various statistics for each column in your data. These statistics include minimum, maximum, mean, median, mode, number missing, and much more. In addition, the exploreData action will group variables according to their data type and their values on various statistical metrics. These groupings allow for a pipelined approach to data cleaning. Furthermore, there is an optional explorationPolicy. This policy specifies how the data is grouped together. Using the exploreData action is as easy as specifying your data table, your target, and the name of your output table.
/* Explore data using the exploreData Action */ proc cas; loadactionset "dataSciencePilot"; dataSciencePilot.exploreData / table = "hmeq" casOut = {name = "EXPLORE_DATA_OUT", replace = True} target = "BAD" explorationPolicy = {cardinality = {lowMediumCutoff = 40}} ; run; quit; |
The exploreCorrelation action
The exploreCorrelation action performs a correlation analysis with your data. There are two ways you can approach this correlation analysis. First, if you specify a target variable, the correlation analysis will only include correlations from the input variables against the target. However, if you do not specify the target, the analysis will be performed on all variables against each other. That is a lot of correlations! It is even more impressive considering correlation measures are not valid between all data types. This action will take care of managing data types and the appropriate correlation measures with no additional user input required.
/* Explore correlations using the exploreCorrelation Action */ proc cas; loadactionset "dataSciencePilot"; dataSciencePilot.exploreCorrelation / table = "hmeq" casout = {name = "CORRELATION_OUT", replace = True} target = "BAD" ; run; quit; |
The analyzeMissingPatterns action
The analyzeMissingPatterns action helps a data scientist better understanding missingness in their data set. Before you throw out a column because of missing data, check to see if that missingness has any meaning. Does a specific value or missing value in one column make it more likely for a value to be missing in another column? For this action, you can specify a target variable to narrow down the analysis. This will only check for patterns between each input variable and the target. Otherwise, patterns between all variables will be examined.
/* Explore missing data using the analyzeMissingPatterns Action */ proc cas; loadactionset "dataSciencePilot"; dataSciencePilot.analyzeMissingPatterns / table = "hmeq" casout = {name = "MISS_PATTERN_OUT", replace = True} target = "BAD" ; run; quit; |
The screenVariables action
The final action set included in this blog is the screenVariables action. The screenVariables action recommends to keep, transform, or remove variables. This recommendation is based off of several factors including missingness, consistency, redundancy, variance, leakage, and more. By editing the screenPolicy, you can control how much data messiness is acceptable. In short, this action helps a data scientist understand their data quality, allowing them to think of next steps for data cleaning.
/* Screen variables using the screenVariables Action */ proc cas; loadactionset "dataSciencePilot"; dataSciencePilot.screenVariables / table = "hmeq" casout = {name = "SCREEN_VARIABLES_OUT", replace = True} target = "BAD" screenPolicy = {missingPercentThreshold=35} ; run; quit; |
Conclusion
As evident from our snippets, the code for the Data Science Pilot Action Set is incredibly easy to use. Our only requirements are the name of our CAS table and the name of the target variable (for most actions). In addition, we can use the explorationPolicy and the screenPolicy to take more control over the process. This means that we can gather so much information in just a few lines of code! In this blog, we focused on building our data understanding and examining data quality. In upcoming blogs, we will examine feature engineering and automated machine learning.


2 Comments
Great post, Sophia. Looking forward to the next pieces.
Great introductory post. Looking forward to your upcoming blogs on this.