The connection between SAS Viya and the Austrian mountains
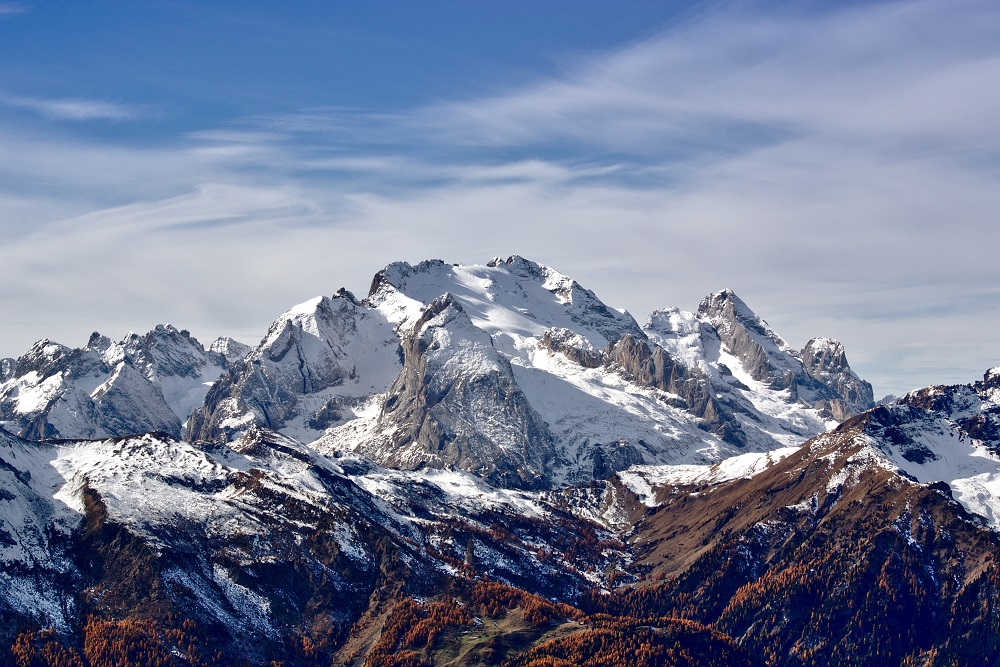
Friends from Tyrol recently visited me in Burgenland at Lake Neusiedl. Tyrol is an area famous for really high mountains. Tourists from all over the world come to Tyrol to experience the fantastic views and hikes.
So my friends laughed when I told them the 50-meter-high hills near our apartment were called "Roses Mountain" and "Unger Mountain" (Rosenberg and Ungerberg). They said, "Where we live, they wouldn't even have a name."
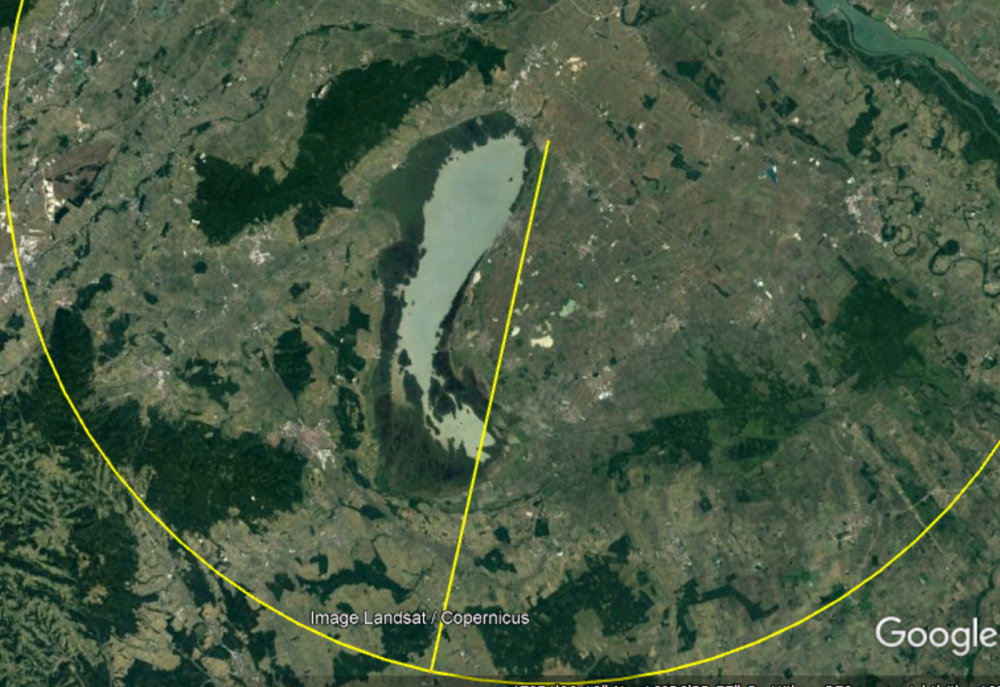
Their opinion changed, however, when we walked up these tiny hills (no, we did not climb them 😊). From the top, we saw an area of about 50 to 60 kilometres in diameter: all of Lake Neusiedl, the beginnings of the Austrian Alps with mountains higher than 2,000 meters, and also far into Hungary.
Machine learning and deep learning generate important insights
Yes, it might be too simple to say that just a small observation gives us a marvellous view and insight into many details of a certain countryside. My friends agreed that in Tyrol, we would need to hike three hours to have a similar view.
Later we had a glass of excellent Burgenland wine at the Heurigen, and I realized our experience perfectly mirrored analytical maturity levels in a certain state with certain requirements. And now I have arrived at the connection between the Austrian mountains and SAS Viya I mentioned at the beginning of this article.
My friends are the kind of people who would build complex machine learning models. Their region is the first address in terms of deep learning (sorry, deep valleys). When they go hiking, they equip themselves properly. Just like data scientists do when they build a complex machine learning model, e.g., by using SAS VDMML or the DLPY package from Jupyter Notebook.
Exploring the data and displaying the analysis results are also important
Business users and citizen data scientists do not always need a complex model to get further insights. Some business questions only require descriptive statistics, enabled with a high level of interactivity in a graphical user interface and enhanced by self-service analytics (decision trees and causal models) and self-service data preparation (like filtering or by-group processing).
For these users, climbing "Roses Mountain" is sometimes enough to get extraordinary insight into the data and gain business advantages.
Austria is like SAS Viya: We have it all!
Just as experts who build powerful machine learning techniques also apply basic statistical methods to profile their data and illustrate their findings, my friends frequently visit me here and enjoy the amenities of Burgenland.
In return, I often join them for hiking to get an extraordinary view of the country. This is like the business user who consults the analytical expert for advice on more complex relationships or with a request to build a predictive model.
SAS Viya: Machine learning techniques are just a click away from visual exploration
The important thing is the proximity of the two points of view. In Austria, I can jump into my car and be up at 3,000 meters or higher on the same day. The same applies to SAS Viya. Machine learning techniques are just a click away from visual exploration.
| I enjoy living in Austria because it offers high mountains for hiking with deep and spectacular views into the valleys and also the area around Lake Neusiedl, which is great for cycling and sailing. | I enjoy working with SAS Viya because it offers me a wide range of machine learning techniques to generate deep insights into my analysis data and visualization to quickly explore my data and communicate the results to my business users. |