Because of their brevity, tweets can be difficult to analyze. In this blog, I used SAS Visual Text Analytics (VTA) 8.4 to analyze 40,000 tweets posted from September 20, 2019 to September 27, 2019. At least 7 million people, mostly youth, in more than 700 cities across the globe, demanded the world to act to combat global warming. Specifically, I used the machine learning algorithms for Fact Rule Autogeneration to see people’s specific demands.
On Friday, September 20, 2019, an estimated 4 million youth and kids in 165 countries participated in the first leg of the global demonstration, the second leg took place on Friday, September 27th. Early numbers confirmed at least 7 million people joined the #FridayForFuture climate strikes. The Climate Group hosted the Climate Week Opening Ceremony on the morning of Monday, September 23, followed by the UN Secretary General’s Climate Action Summit later that day.
Using SAS Visual Analytics (VA), I imported 40,131 tweets posted from September 20, 2019 to September 27, 2019 using these hashtags: #FridayForFuture, #ClimateStrike, #GlobalClimateStrike, #ClimateAction, #SchoolStrike4Climate, #ClimateWeekNYC, and #NaturalClimateSolutions.

Step One: Importing Tweets in Visual Analytics (VA)
In this step, I briefly review how to import tweets and show how to use the Profile to determine which columns to keep in VA.
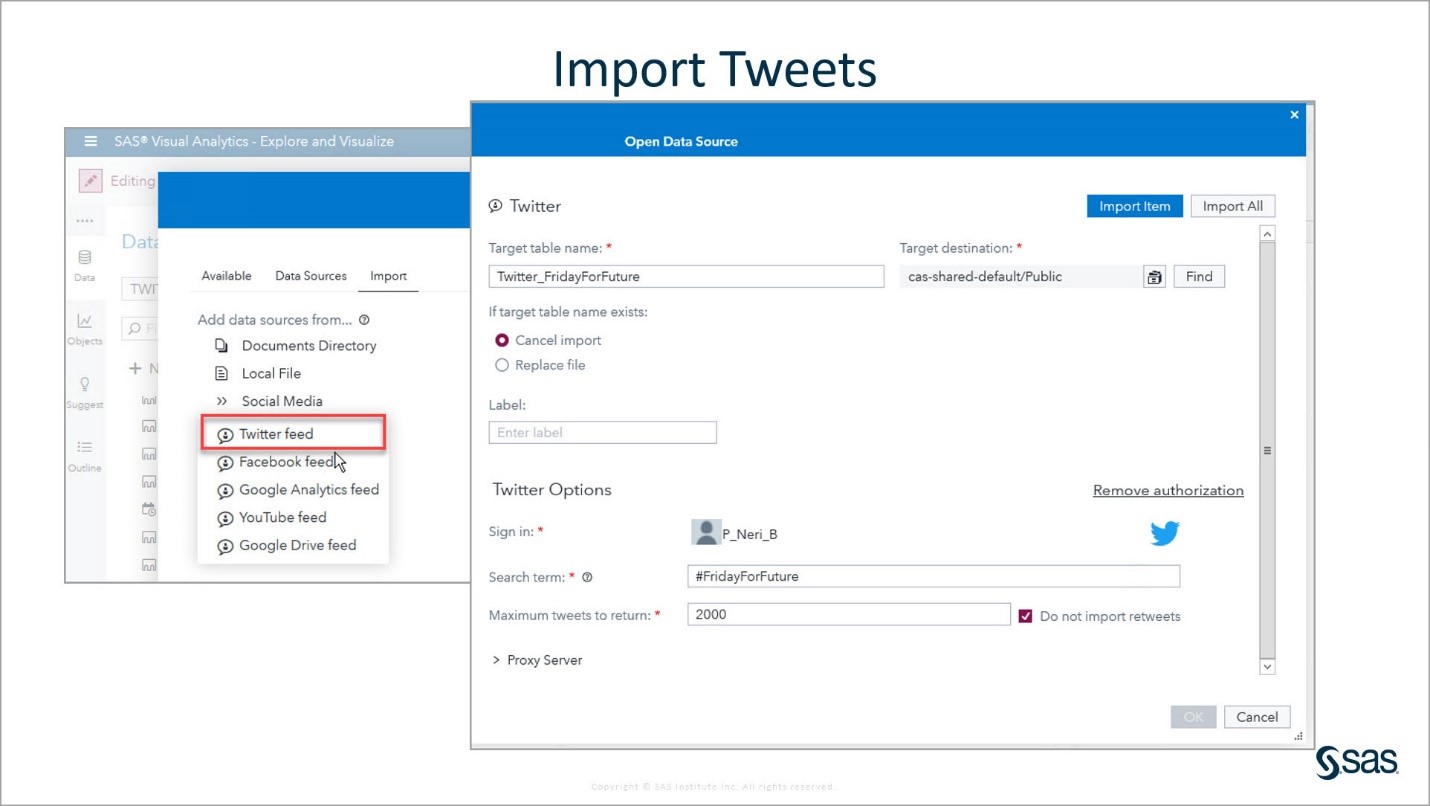
To import tweets into VA, you need a Twitter account to sign in. Only 2,000 tweets can be imported at a time. You need to indicate the target table name and CAS library destination. In this screenshot, the target table is Twitter_FridayForFuture and the CAS library destination is the CAS Public library.
I ended up with 20 datasets for the different hashtags and days when I imported the tweets. Because this was a global demonstration, I knew the tweets were in many languages. Since, VTA projects can currently only analyze one language at a time, I wanted to keep the tweets in English.
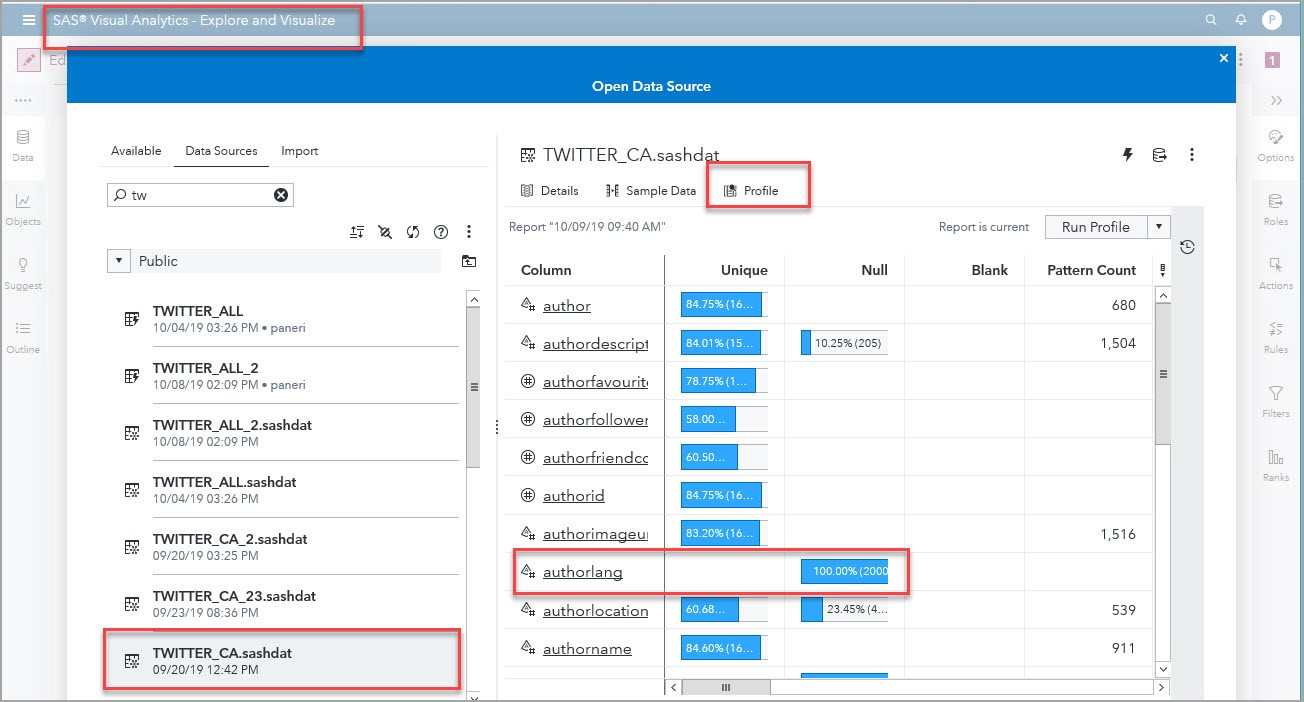
Once data is loaded into CAS, you can use the Profile tab to run a Profile. I ran it on one of the datasets because I wanted to see if I could use the authorlang (author’s language) field to select only the tweets in English. As you can see in the screenshot below, the authorlang field was 100% null; therefore, I couldn’t use language as a filter. I decided to keep only the tweets' Body columns that contain the tweets themselves.
Step Two: Combining Datasets and Adding a Unique Identifier in SAS Studio V
As Stephen Foerster mentions in his blog Threads and CAS DATA Step: “SAS Cloud Analytic Services (CAS) is the cloud-based run-time environment for data management and analytics. CAS spreads its data and its processing over multiple machines. On each of those machines, the data is divided further into blocks, while the processing is divided further into threads. Each thread grabs a subset of the data blocks on its machine and performs the prescribed logic on that subset. The results from all the threads are then gathered together and output.”
In this step, I show code to append several tables and to create a unique column ID in this multi-threaded environment. This unique ID column is created automatically in VTA, but you need to create it beforehand if you want to analyze datasets in VA or if you want to code Text Analytics Action Sets in SAS Studio V, as I show in my blog Sentiment Analysis using DeepRNN Action Set.
Several times, I reached the limit allowed to import tweets. I had 20 individual datasets each with 2,000 tweets. I wrote the code shown below in SAS Studio V. Appending seven individual tables at a time, I created three intermediate tables which I appended to get a final table with the 40,131 tweets. In the final table, TWITTER_ALL, I created a unique ID column. Here is the code:
/* Start a CAS session named mySession */ /* Declare caslibs PUBLIC and ANALYTIC */ cas mySession sessopts=(caslib=ANALYTIC timeout=1800 locale="en_US" metrics=true ); libname PUBLIC cas caslib=PUBLIC; libname ANALYTIC cas caslib=ANALYTIC; /* Code used to append tables. I appended about 7 tables at a time producing intermediate tables such as twitter_FFF_N. The code below shows the final 7 tables appended into twitter_FFF_3*/ data public.twitter_FFF_3 (keep= body); set public.twitter_CA27b public.twitter_cs27b public.twitter_cwnyc_27b public.twitter_fff27 public.twitter_gcs27B public.twitter_SS4C_27B ; run; /* I had 3 intermediate tables. Notice that when I produce the final table, I create a unique identifier column */ data public.twitter_FFF_FFF2_FF3; set public.twitter_fff_FFF2 public.twitter_fff_3; if _N_ = 1 then do; mult = 10 ** (int(log10(_NTHREADS_)) + 1); retain mult; drop mult; end; ID = _THREADID_ + (_N_ * mult); run; /* I promoted the final table to the ANALYTIC library, so I could develop VTA models based on this dataset */ proc casutil; promote casdata="twitter_FFF_FFF2_FF3" Incaslib="PUBLIC" Outcaslib="ANALYTIC" CASOUT="TWITTER_ALL"; run; *cas mySession terminate; |
For details on how to create a Text Object in VA, and a VTA project, please check out my blog Visual Text Analytics identifies urgency over global warming in COP24 tweets.
Step Three: Working in the Data Tab of the VTA Pipeline
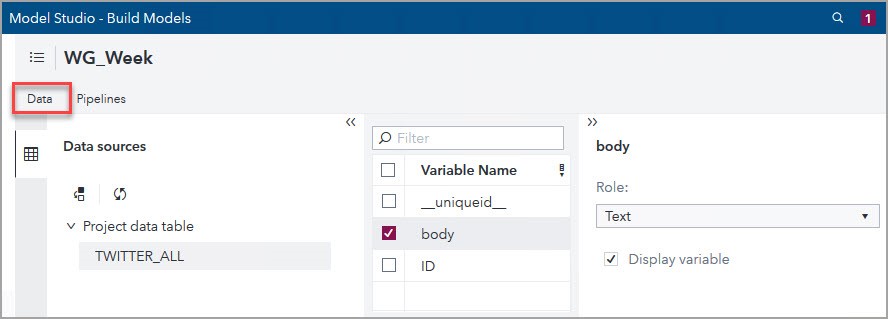
For this blog, I created the WG_Week text analytics project using the default template and the data ANALYTIC.TWITTER_ALL. Then, in the Data tab of the VTA pipeline, I indicated that body is the Text variable. You might notice that there is a column _uniqueid_; as I mentioned before, it is the unique identifier that VTA automatically produces for all its projects.
Step Four: Working in the Concepts Node of the VTA Pipeline
In this step, I show how to use the machine learning algorithms embedded in this node to quickly find insights on the youths' tweets. Most of them are younger than 18, and since Twitter is available practically anywhere in the world, we can expect the youth to continue using this channel in the future. Using VTA to analyze tweets is a great option!
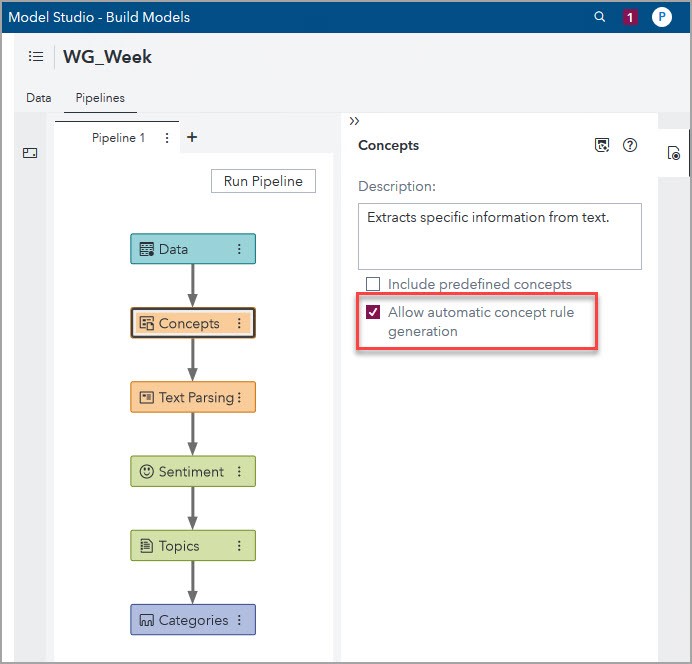
To use the machine learning algorithms for Autogenerate Fact Rules, from the Pipelines tab, select the Concepts node, check the “Allow automatic concept rule generation” box as the screenshot below shows, right click the node, click Run, and after it finishes running click Open.
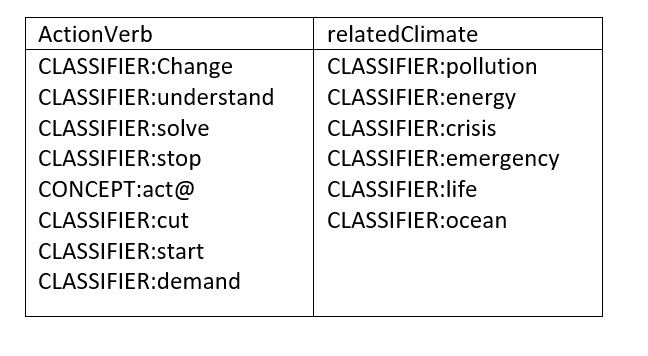
Due to the brevity of tweets, one must identify what the key issues are to analyze and create Concepts that can be utilized to create useful Fact Rules. This is the case for all text analytics projects, it is important to identify the key issues or answers one wants to find. Then, create Custom Concepts based on business knowledge to help answer that question. Since I was interested on knowing what the youth are demanding, I created the two Custom Concepts: ActionVerb and relatedClimate.
For both Concepts, I started defining them using the Create CLASSIFIER Rule and added CONCEPT LITI rules, as I describe in the next paragraphs.
Click on New Concept, and enter in the Add Custom Concept window “ActionVerb” as shown in the screenshot below.

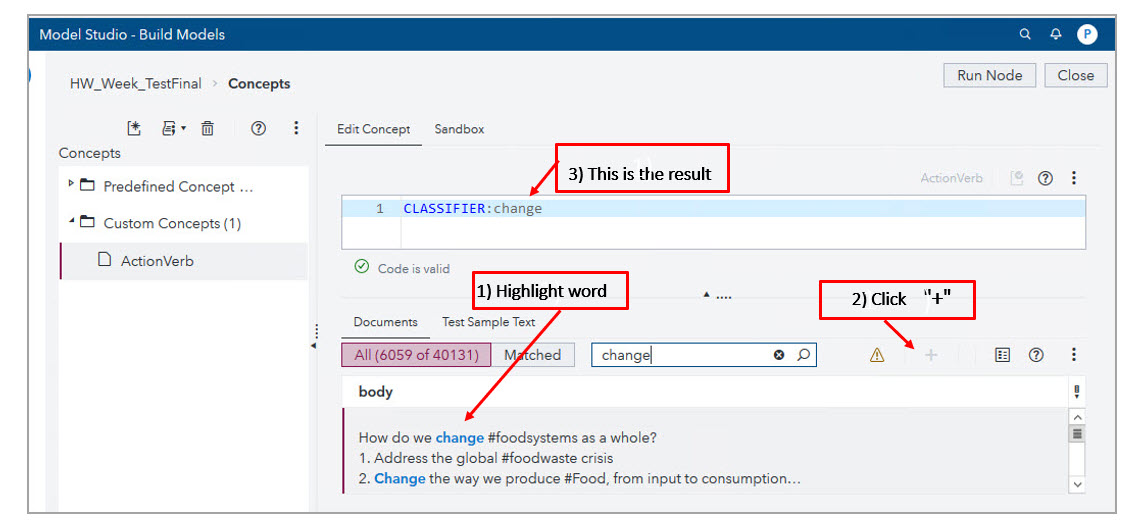
The ActionVerb Custom Concept includes verbs that could help me find what the youth were demanding. To define it, I used the Create CLASSIFIER Rule by highlighting the text in the Documents tab and clicking the plus button.
Also, I added CONCEPT LITI rule definitions, such as CONCEPT:act@ to match these words: act, acts, acting. Here is a screenshot that shows the final definition of the ActionVerb custom concept:

CLASSIFIER:Change
CLASSIFIER:understand
CLASSIFIER:solve
CLASSIFIER:stop
CONCEPT:act@
CLASSIFIER:cut
CLASSIFIER:start
CLASSIFIER:demand |
In a similar way, using the Create CLASSIFIER Rule and adding CONCEPT LITI rules, I defined the relatedClimate Custom Concept, which includes words related to Global Warming themes. Here is a screenshot that shows its final definition:
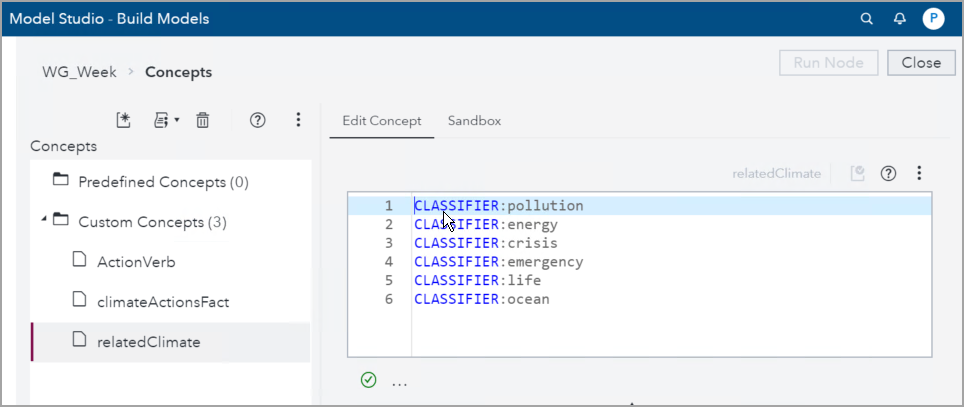
CLASSIFIER:pollution CLASSIFIER:energy CLASSIFIER:crisis CLASSIFIER:emergency CLASSIFIER:life CLASSIFIER:ocean@ |
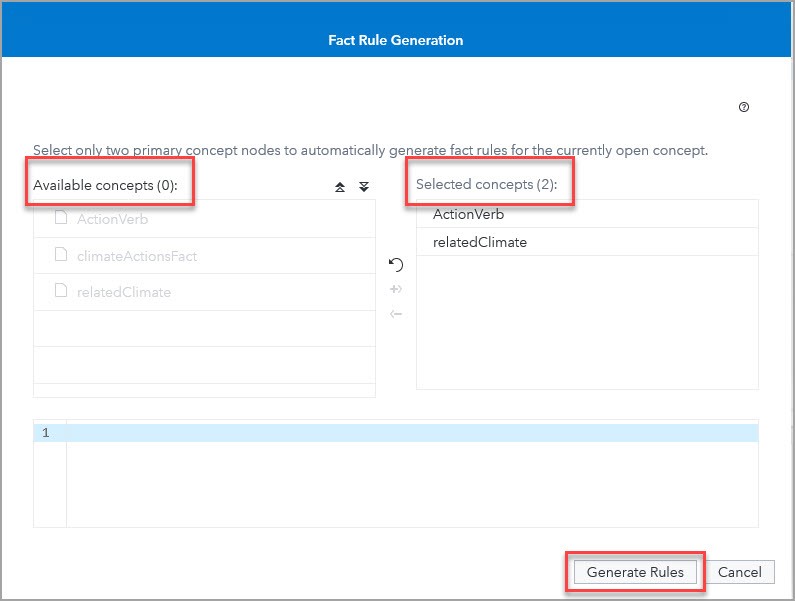
Facts are related pieces of information in a document. To see specifics on which actions the youth are demanding, I created the climateActionsFact using the Autogenerate Fact Rule to see relationships between the ActionVerb and relateClimate concepts. First, I created a new custom concept climateActionsFact and selected Autogenerate fact rules:

When the Fact Rule Generation box appeared, I moved the two custom concepts from the Available concepts column to the Selected concepts column and clicked Generate Rules:
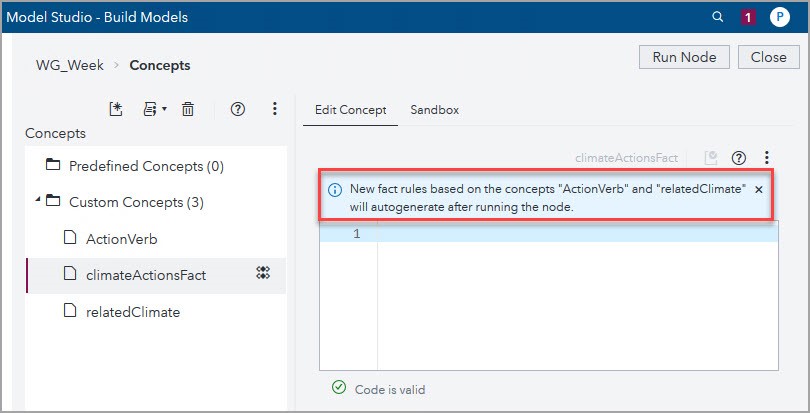
Now that I’ve given the autogenerate engine two concepts, I have to rerun the node so that VTA can autogenerate the PREDICATE_RULE that describes the climateActionFact.
After the node ran, the results appeared in the Sandbox, and I copied the resulting PREDICATE_RULE to the Edit Concept window and ran the node again to see the matching documents.
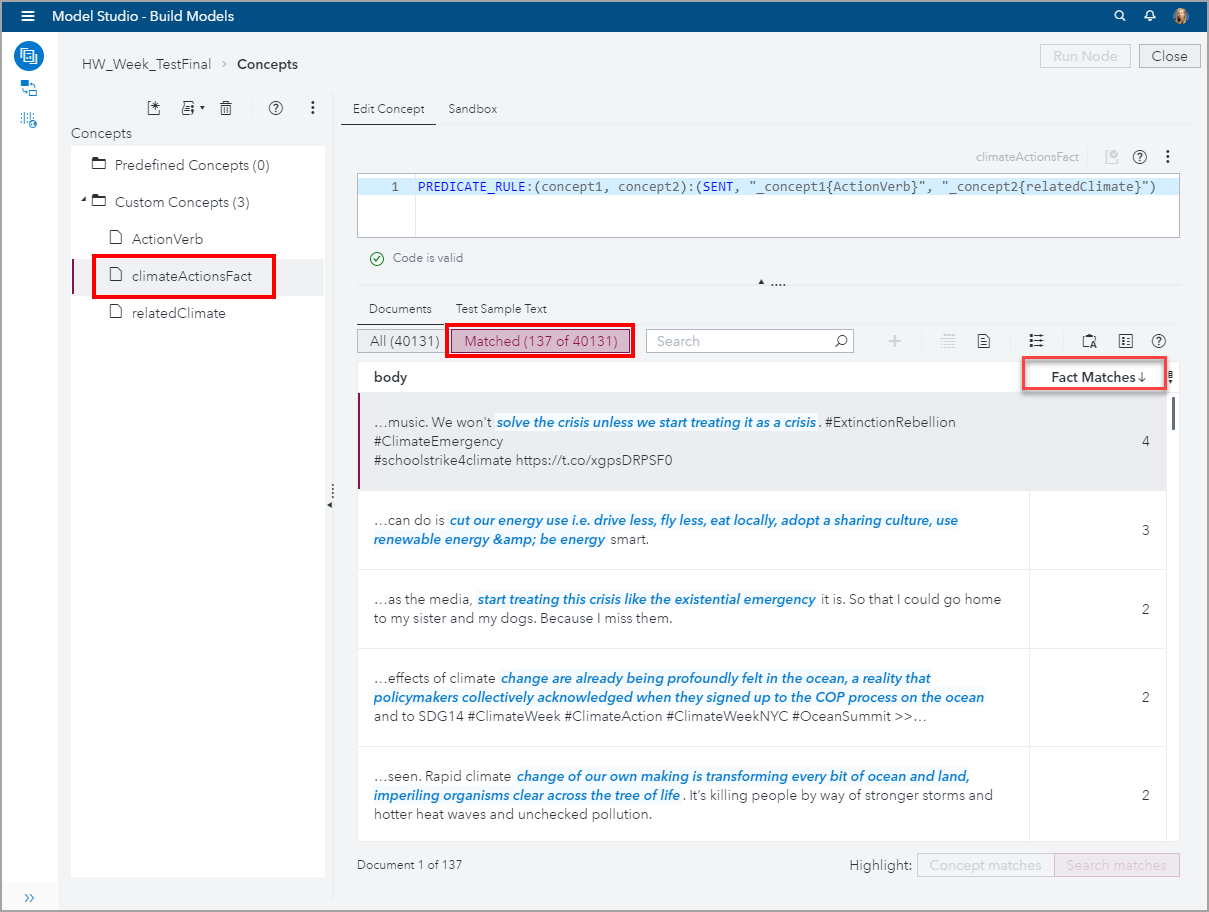
Let’s take a look at what this PREDICATE_RULE is doing. Here is the syntax:
PREDICATE_RULE:(concept1, concept2):(SENT, "_concept1{ActionVerb}", "_concept2{relatedClimate}") |
And to recall, here are the custom concepts we defined earlier:
Therefore, PREDICATE_RULE:(concept1, concept2):(SENT, “_concept1{ActionVerb}”, “_concept2{relatedClimate}”) will return matches where any combination of both the ActionVerb and relatedClimate concepts are found within the same sentence.
There were 137 out of 40,131 tweets that matched this PREDICATE_RULE. That means that VTA’s machine learning algorithms examined 40,131 tweets and determined that 137 satisfied the logic expressed in this PREDICATE_RULE. Remember how this started, I selected 8 words to define a Concept to express action verbs, then I selected 6 words to define another Concept to express climate related words. Using those 18 words, VTA autogenerated the PREDICATE_RULE and then its machine learning algorithms found meaningful relationships between these two Concepts that reflect the demands that people, mostly youth, expressed on those tweets.
In the screenshot below, you can see the tweets with the highest number of Facts matched with the climateActionsFact. The right column titled Fact Matches indicates how many text matches were found on the document to its left. The highest number of matches was 4.
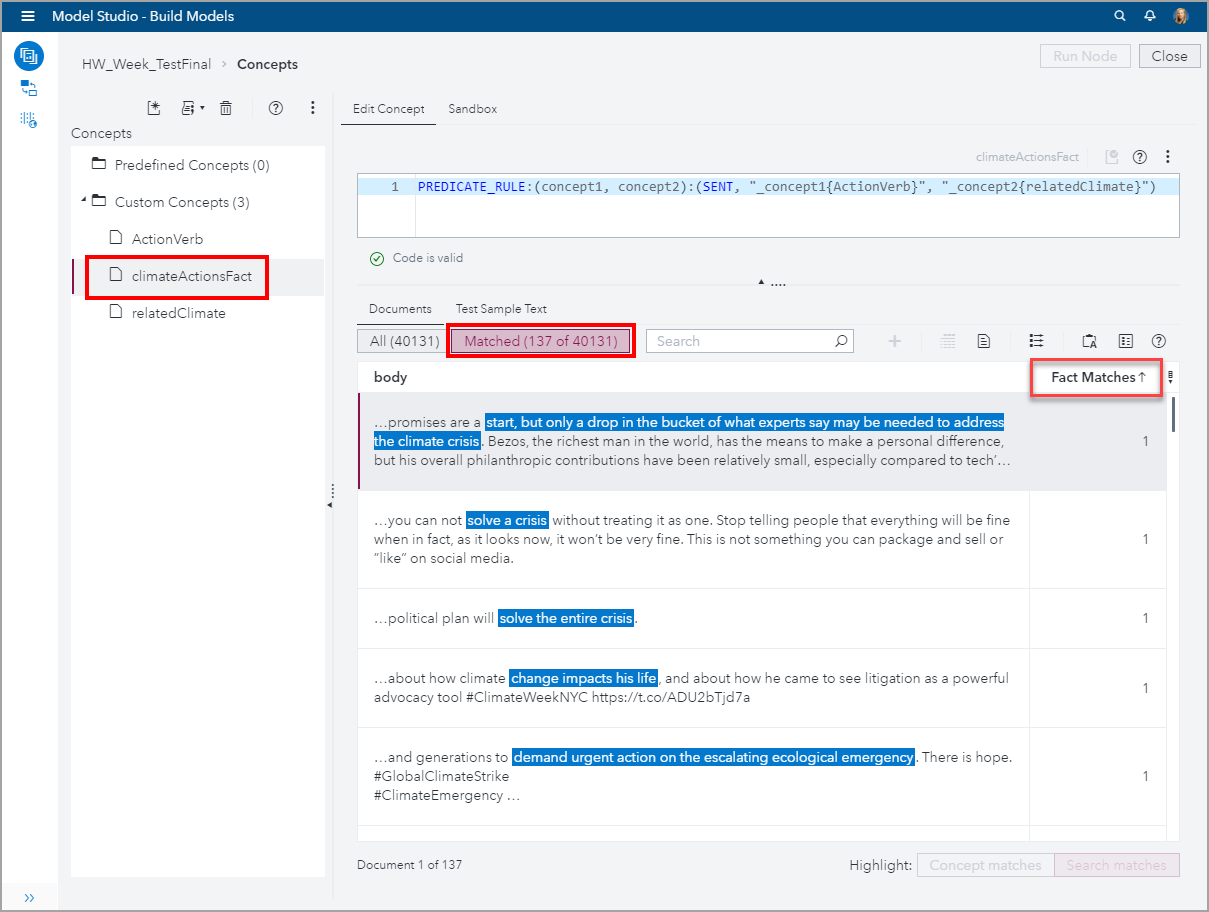
In the next screenshot, you can see the tweets with only one Fact matched with the climateActionsFact. Even, when there is only one matched Fact, it is interesting to see the significant relationships found by the machine learning algorithms between the two Concepts which had simple definitions.
Conclusion
Analyzing tweets is challenging because of their succinctness (max 280 characters). However, that task is facilitated by the powerful features of SAS Visual Text Analytics (VTA), which includes embedded machine learning algorithms. In this blog, I used the Autogenerate Fact Rule to quickly find relationships between related pieces of information and to identify specific actions that people were recommending.
Next Steps
Here are some additional links related to this week events:
- Greta Thunberg’s full speech at the United Nations Climate Action Summit
- Why young climate activists have captured the world’s attention
- The public is waking up to global warming
- The WIRED Guide to Climate Change
Here are few additional articles on using VTA to analyze text: