Learn SAS

Learn about the latest tips, tutorials, upcoming events and certifications
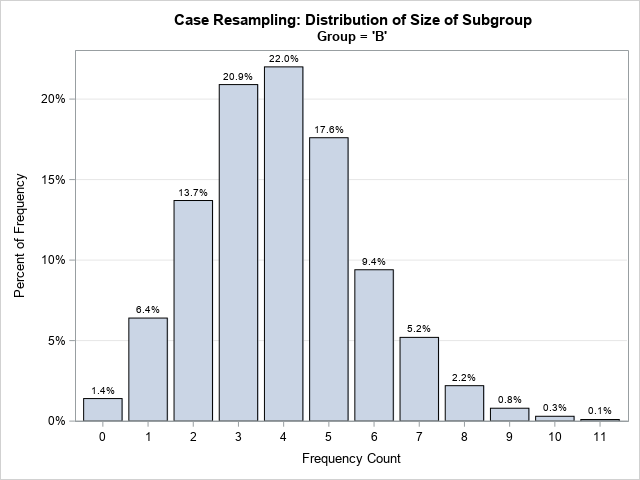
Data Visualization | Learn SAS | Programming Tips
Sanjay Matange 0
A Graphical Journey

The ODS Graphics software, first released with SAS 9.2, supported creating graphs directly from statistical procedures.  Prior to this, very few statistical procedures created graphs on their own, and in most cases creating graphs was a post process or creating the graphs from the saved data using SAS/GRAPH procedures. With

Analytics | Data Management | Learn SAS | Machine Learning
Michael Herrmann 0
DevOps & SAS: Entwicklung und Betrieb aus einer Hand?

K(o)ennen Sie schon „DevOps“? Machen Sie SAS? Dann lohnt sich eventuell ein frischer Blick auf die Kombination! Denn immer mehr Unternehmen probieren, ihren produktiven Betrieb auch in die Hände der Software-Entwickler zu legen (2 von 3 laut Jenkins) – speziell in der Analyse, insbesondere beim agilen Modellieren und dem Veredeln

Advanced Analytics | Learn SAS | Machine Learning
SAS Korea 0
머신러닝 해석력 시리즈 4탄: 라임(LIME)으로 모델 해석력 개선하기!

그 동안 머신러닝 해석력 시리즈를 통해서 머신러닝의 부분 의존성(PD; Partial Dependence), 데이터 세트 해석 등을 소개해드렸는데요. 오늘은 라임(LIME; Local Interpretable Model-Agnostic Explanation)을 통해 머신러닝 모델의 해석력을 개선할 수 있는 방법에 대해서 알아보겠습니다. 머신러닝 모델 해석력 시리즈 1탄, 2탄, 3탄을 놓치셨다면 아래 링크를 통해 확인해주세요! 머신러닝 해석력 시리즈 1탄: 인공지능(AI)과 머신러닝을 신뢰하기 위한 필수

Data Visualization | Learn SAS | Programming Tips
Sanjay Matange 0
The SGPIE Procedure - Part 2

The SAS 9.4M6 software includes a new SGPIE procedure (preproduction) as introduced in the recent article - The SGPIE Procedure.  In that article, I described the basic features of the two statements supported in the procedure, the PIE and the DONUT, with some examples. It is my humble opinion that

1 16 17 18 19 20 47

Back to Top