Find out how analytics, from data mining to cognitive computing, is changing the way we do business
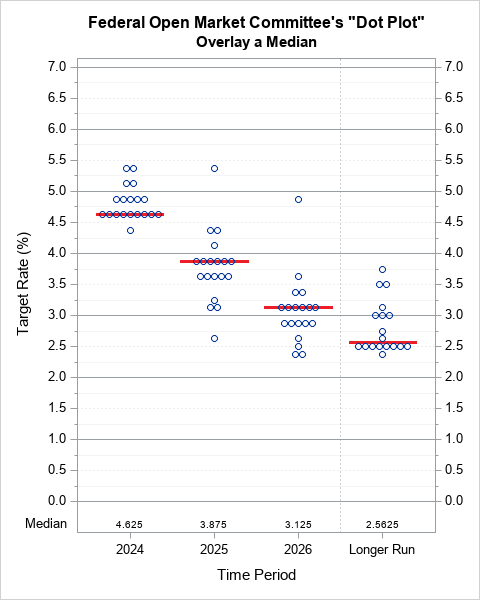
Improve the Federal Reserve's dot plot

A dot plot is a standard statistical graphic that displays a statistic (often a mean) and the uncertainty of the statistic for one or more groups. Statisticians and data scientists use it in the analysis of group data. In late 2023, I started noticing headlines about "dot plots" in the