The new SAS developer portal has a permanent home Say sayonara to the old SAS developer portal. We recently shut it down. The new portal is live and has a new home. The old and new sites were living side by side while we finished up some development work. Now
Tag: sas r&d
Geocoding is no longer limited to just Base SAS. You can also geocode from within Visual Analytics, thanks to the integration with the Esri geocoding api. This feature is part of the Esri Premium agreement, and became available in VA 8.3.
If you spend any time working with maps and spatial data, having a fundamental understanding of coordinate systems and map projections becomes necessary. It’s the foundation of how spatial data and maps work. These areas invariably evoke trepidation and some angst, even in the most seasoned map professional. And rightfully
The catch phrase “everything happens somewhere” is increasingly common these days. That “somewhere” translates into a location on the Earth; a latitude and longitude. When one of these “somewhere’s” is combined with many other “somewhere’s”, you quickly have a robust spatial data set that becomes actionable with the right analytic
Recently, you may have heard about the release of the new SAS Cloud. The platform allows fast access to data-science applications in the cloud! Running on the SAS Cloud and using the latest container technology, SAS Cloud eliminates the need to install, update, or maintain software or related infrastructure. SAS
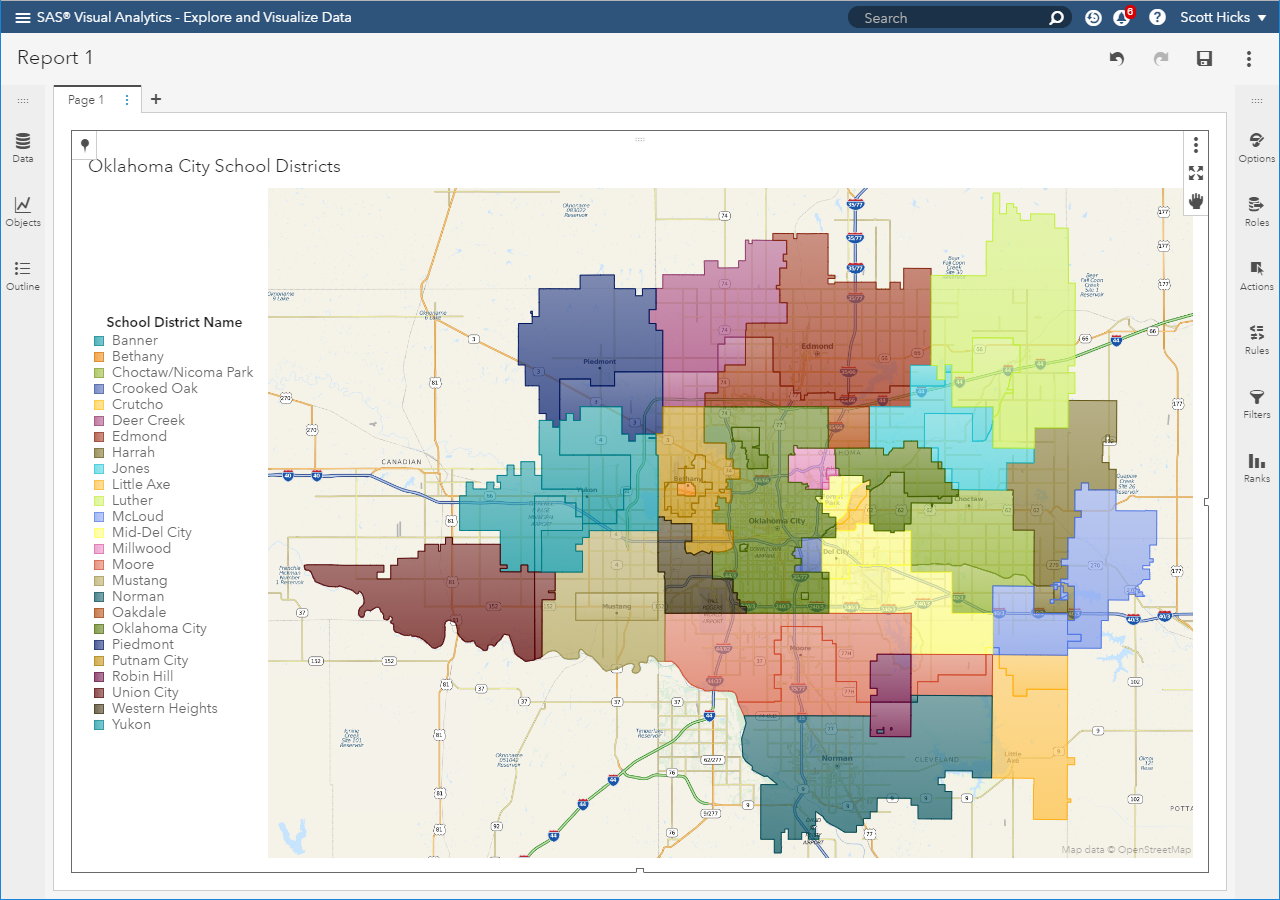
SAS Visual Analytics supports region maps for Country, US states, and provinces out-of-the-box. These work well for small scale maps covering the world, a continent, or a single country. However, other regions are often needed. Beginning in version 8.3, VA supports custom polygons to display regions such as sales territories,
In this post, we continue our discussion of geography variables, the foundation of Visual Analytics Geo maps. This time we will look at Custom Coordinates. As with any statistical graph, understanding your data is key. But when using Custom Coordinates for geographic maps, this understanding becomes even more important. Use
Creating a map with SAS Visual Analytics begins with the geographic variable. This blog post explains the first type of geography variable that VA supports: predefined. Future posts will cover the other two types of geography variables in VA: custom coordinates and custom polygons.
SAS Visual Analytics includes text parsing actions that can help tokenize sentences, and SAS Visual Text Analytics provides even better, more sophisticated methods. This article contains code samples and cites papers for more details.
SAS Visual Text Analytics provides dictionary-based and non-domain-specific tokenization functionality for Chinese documents, however sometimes you still want to get N-gram tokens. This can be especially helpful when the documents are domain-specific and most of the tokens are not included into the SAS-provided Chinese dictionary. What is an N-gram? An
Gradient boosting is one of the most widely used machine learning models in practice. See how to use gradient boosting model for classification in SAS Visual Data Mining and Machine Learning.
Report data shared by educational institutions, government agencies, healthcare organizations, and human resource departments can contain sensitive or confidential data. Data in such reports are suppressed selectively to protect the identities of individuals or to prevent the report’s audience from easily inferring individual values. The Data Suppression feature in SAS
Jazz up your Geo Map or Network Analysis graph by applying icon-based display rule markers instead of color markers on the map. With SAS Visual Analytics, you may have already used display rules by populating intervals or adding color-mapped values for report objects. Now, you can jazz up your Geo
Every year in early October, the eyes of the world turn to Sweden and Norway, where the Nobel Prize winners are announced to the world. The Nobel Prize is considered the world's most prestigious award. Since 1901, the Prize has been presented to individuals and organizations that have made significant
The Dw.p format displays numeric values, in a field w positions wide, possibly with a great range of values, lining up decimals for values of similar magnitude. The BESTDw.pformat combines the BESTw. format for integers and the Dw.p format for nonintegers. Specifying BESTDw.p (where p = w - 1) is better than specifying BESTw. for columns, since decimals do not shift when the last digit is 0.
SAS Visual Analytics 7.4 comes chock-full of new features. Report and section linking come with an added benefit. If you set up linking from one section to another section in the same report, or from one report to another report, you have the option to configure linking such that any filter
In addition to his day job as Chief Technology Officer at SAS, Oliver Schabenberger is a committed lifelong learner. During his opening remarks for the SAS Technology Connection at SAS Global Forum 2017, Schabenberger confessed to having a persistent nervous curiosity, and insisted that he’s “learning every day.” And, he
Community detection has been used in multiple fields, such as social networks, biological networks, tele-communication networks and fraud/terrorist detection etc. Traditionally, it is performed on an entity link graph in which the vertices represent the entities and the edges indicate links between pairs of entities, and its target is to
In 2011, Loughran and McDonald applied a general sentiment word list to accounting and finance topics, and this led to a high rate of misclassification. They found that about three-fourths of the negative words in the Harvard IV TagNeg dictionary of negative words are typically not negative in a financial
As a practitioner of visual analytics, I read the featured blog of ‘Visualizations: Comparing Tableau, SPSS, R, Excel, Matlab, JS, Python, SAS’ last year with great interest. In the post, the blogger Tim Matteson asked the readers to guess which software was used to create his 18 graphs. My buddy,
Recently a colleague told me Google had published new, interesting data sets at BigQuery. I found a lot of Reddit data as well, so I quickly tried running BigQuery with these text data to see what I could produce. After getting some pretty interesting results, I wanted to see if
In my last post, I showed you how to generate a word cloud of pdf collections. Word clouds show you which terms are mentioned by your documents and the frequency with which they occur in the documents. However, word clouds cannot lay out words from a semantic or linguistic perspective.
Last week, I attended the IALP 2016 conference (20th International Conference on Asian Language Processing) in Taiwan. After the conference, each presenter received a u-disk with all accepted papers in PDF format. So when I got back to Beijing, I began going through the papers to extend my learning. Usually, when
Tablets, phablets, smartphones. These mobile devices not only travel to different corners of the earth with their owners; they participate in certain adventures that can result in an unexpected turn of events. Thanks to their mobility, these devices can be misplaced. And they could be found later. In rare cases,
Mobile devices travel with humans pretty much anywhere that humans want to go. Unlike desktop computers that stay fixed and grounded within brick and mortar walls, mobile devices are used in all sorts of locales – offices, homes, cars, planes, swimming pools, soccer fields, movie theaters – the list goes
“My goal is to constantly improve the quality and stability of our software while at the same time innovating,” said Vice President of SAS Resarch and Development Armistead Sapp yesterday at the SAS Global Forum Technology Connection. Hosted by Product Management Director Michele Eggers, the Technology Connection focused not only on
Bridging the Rift between Dev and Ops As a member of the Product Marketing team at SAS, I spend a good part of my time researching – analyst reports, industry journals, blogs, social channels – and listening to what our customers are saying. Early last spring I began noticing the term