SAS Visual Analytics supports region maps for Country, US states, and provinces out-of-the-box. These work well for small scale maps covering the world, a continent, or a single country. However, other regions are often needed. Beginning in version 8.3, VA supports custom polygons to display regions such as sales territories, counties, or zip codes.
Region (choropleth) maps use a fill color to show relationships between the regions based upon a response value from your data. Using custom polygons in VA follows the same steps outlined in previous posts for predefined or custom coordinate geography items, with just a few additional steps. Here’s the basic flow:
- Identify your data
- Import polygon shapefile into SAS dataset
- Import the shape dataset into VA
- Create a Custom polygon provider
- Create the geography item
- Create and customize the map
Before we begin
VA supports two sources for creating custom polygons: Esri shapefiles and Esri Feature Services. The goal for this post is to show how to create custom polygons using an Esri shapefile.
Typically, when working with custom polygons, you will have two datasets: the first defines the custom regions (shape data) and the second contains the data you wish to map (business data). The shape data is derived from an Esri shapefile or feature service. The business data can be in a shapefile or any format supported by VA (.sas7bdat, .csv, .xls, etc). It contains the information you want to analyze distributed across the regions defined by the shape data.
It is recommended that you verify the imported shape data before using it in your final map. This will confirm the data is valid and make debugging an issue easier should you encounter any errors. To verify, use the same dataset for both the shape and business data. The example below will use this approach.
Access to a GIS application such as Esri’s ArcGIS or QGIS is recommended. There are two areas where they can help you prepare to use custom polygons in your VA map:
- Creating a shapefile to define polygons specific to your business need or application
- Viewing the attribute table of existing shapefiles to determine its unique identifier column
For this example, we will be creating a map of registered Neighborhood Associations in Boise, Idaho. To follow along, download the data from the City of Boise open data site: Boise Neighborhood Associations
1. Identify your data
Shape data
The shape data defining the custom regions needs to be in an Esri shapefile format. These files can be created in a GIS application or obtained from a wide variety of online sources such as: the US Census Bureau (http://www.census.gov); local and state municipalities; state agencies such as the Department of Transportation; and university GIS departments. Most municipalities now have Open Data portals that provide a wealth of reliable data for public use. These sources are maintained by dedicated staff and are updated regularly.
Business data
The business data can be specific to your company’s operation or customer base. Or it can be broad and general using census or demographic information. It answers the question of What you want to analyze on the map. The business data must contain a column that aligns with your shape data. For example: If you want to map the age distribution and spending habits of your target customers across zip codes, then your business data must have a column for zip codes that allows it to be joined to a zip code region in the shape data.
2. Import polygon data into a SAS dataset
VA 8.3 does not support the native shapefile format. To use a shapefile in VA, you must first import it into SAS. Included with Viya3.4, the %shpimprt macro will convert a shapefile into a SAS dataset and load it into CAS. You can find the documentation for it here: %shpimprt documentation.
Alternatively, the shapefile can be manually imported with these basic steps:
- Import the shapefile into SAS
- Add a sequence column to the dataset
- Reduce the density of the dataset
- Limit the dataset based on the density value
Additional details and sample code for each of these steps can be found in the text file linked here: Manual shapefile import steps.
3. Import the shape dataset into VA
Next, we must import the dataset into VA, if using the manual shapefile import process. To do this, locate the data pane on the left of VA. From the ‘Open Data Source’ window, select Import > Local File. Navigate to the location of the SAS dataset created from Step 2 and click the Open button.
Adjust the target location as needed, based on your VA installation, and make note of the location selected. This path will be required to configure the custom polygon provider. Review and adjust the other options as needed. Click the blue ‘Import Item’ button at the top of the window to start the import process. A message will appear indicating the import status. Upon successful import, click the 'OK' button to open the dataset.

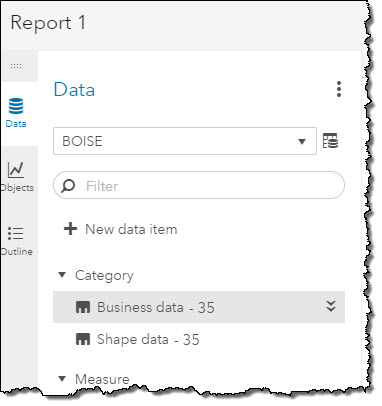
Since we are using the same dataset for the shape and business data, we need to make a copy of the category variable that will be used for our map. Right click on ‘ASSOCIATIO’ and select ‘Duplicate’. Next, let’s change the names of both variables to better distinguish them from one another:
- Change ‘ASSOCIATIO’ to ‘Business data’
- Change ‘ASSOCIATIO (1)’ to ‘Shape data’
4. Create the geography item
We are now ready to start creating the geography item. With Custom polygons, an additional step is required beyond what was described in previous posts with predefined and custom coordinates geography items. We must define a Custom Polygon provider so VA knows how to locate and display the Boise Neighborhood Associations. This is needed only once and is part of the geography item setup you are familiar with.
Our goal is to map the regions of the Boise Neighborhood Associations, so we will use ‘Shape data’ for our geography item. Locate it in the VA data panel and change its Classification type to ‘Geography’. From the ‘Geography data type’ dropdown, select ‘Custom polygonal shapes’. Several new fields will be displayed. In the ‘Custom polygon provider’ dropdown, click the ‘Define new polygon provider’ button.
A ‘New Polygon Provider’ window will appear. All fields shown are required. The Advanced section has additional options, but they are not needed for this example.
Configure the fields based on the following:
- Name / Label – Enter ‘Boise Neighborhoods’ for both (these values do not have to be the same)
- Type – The default CAS Table is the correct option for this example.
- Server / Library – These values must match those used for the data upload in Step 3.
- Table – Select the name of the table uploaded in Step 3 (Boise_Neighborhoods)
- ID Column – The unique identifier column of the dataset. Used to join the shape and business data together. (Select OBJECTID)
- Sequence Column – This column is created during the import process from Step 2. Needed by VA to display the custom regions. (Select SEQUENCE)
The custom polygon provider is now configured. All that is needed to finish the geography item setup, is to identify the Region ID. This is the crucial step that will join the shape data to the business data. The Region ID column must match the ID Column chosen when the custom polygon provider was setup. Since we are using the same dataset in this example, that value is the same: OBJECTID.

In cases where different datasets are used for the shape and business data, the name of Region ID and ID Column may be different. The column labels are not important, but their content must match for the join to occur.
Notice that once you select the correct RegionID value, the preview window will display the custom regions from the imported shape data. The Latitude and Longitude columns are not required in this example. Click the ‘OK’ button, to finish the setup.
5. Create and customize the map
You are now ready to create your map. Drag the Boise Neighborhoods geography item to the report canvas. Let’s enhance the appearance of our map by making a few style changes:
- Set a Color role to shade the Neighborhood Association regions (Roles > Color > Business data)
- Position the legend on the left of the map (Options > Legend)
- Adjust the transparency of the fill color to 45% (Options > Map Transparency)
- Change the map service to Esri World Street Map (Options > Map service)
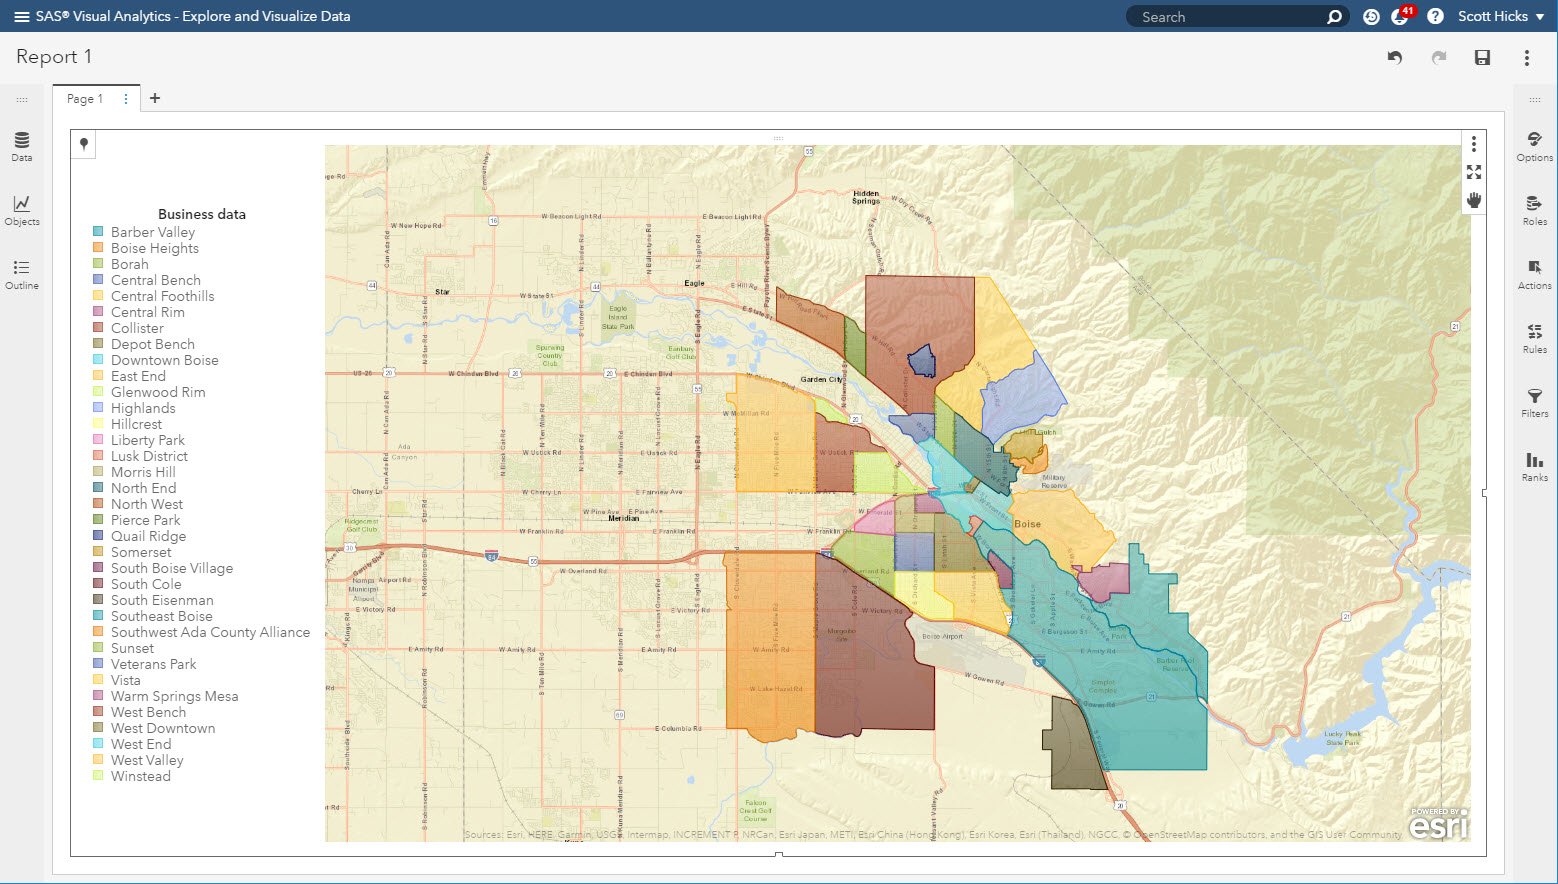
Congratulations! You have just created your first custom region map. In this post we discussed how to use the Custom Polygon provider to define your own regions using an Esri shapefile. Compared to the Predefined and Custom Coordinate options, custom polygons give you additional flexibility and control over how your spatial data is analyzed.

18 Comments
HI Scott,
I am using SAS® Visual Analytics Release: 8.5.2 on SAS® Viya® release: V.03.05 and was happily following along with your blog post, trying to map Boise Neighbourhoods, it is a really good end-to-end example.
However, when I got the part where we would "define a Custom Polygon provider", I got stuck because the [Geography Data] drop-down box in the [Edit Geography Item] dialog box, that I see only shows the following items:
Geographic Name or Code Lookup
Geographic Data Provider
Latitude and Longitude in Data
and not the crucial Custom Polygonal Shapes entry.
Is this a version thing, where the Custom Polygonal Shapes facility is elsewhere in SAS® Visual Analytics Release: 8.5.2 or do you think that this is a configuration thing ?
Many thanks,
Downunder Dave
Wellington
Hi Dave,
By default, only SAS Administrators are granted with the ability to add custom map provider.
Here is the documentation:
https://go.documentation.sas.com/doc/en/vacdc/8.5/varef/n0gvj6tc7l72t8n1e625v04x4vfb.htm
You would need to be a SAS Administrator or ask an administrator to grant access to /maps/providers to yourself or a group that you belong to.
Hi Scott!
I'm trying to develop a basic relationship with a geographic map. In particular I am interested in loading a shape file and reproducing it as a map ...
I followed step by step the example of 'Creating custom regional maps with SAS Visual Analytics' but my final result, as you can see, does not coincide: where could the error be?
Instead of geographical areas, all colored bubbles appear: why?
If you want, having the contact, I send you the image ...
Thank you very much!
greetings , hope all is well!
thank you guys for all this efforts , i just want to ask how can i connect a power bi on primes to this map is there are a way ?
thank you appetited.
Hello, is there anyway to create a geomap using census tract shapes files in SAS VA?
Hi Alan -
Yes, it is possible to create a geomap in VA using census tract data derived from a shape file. In this situation, two (2) datasets must be imported into VA: 1) the shapefile of the census tracts (see step 2 of this post) and 2) the business data you wish to display on the map.
The imported shapefile dataset containing the census tract boundary definitions is then referenced when the custom map provider is defined during the geovariable setup process (step 4 of post). The critical step in creating a custom map provider, is that the shape data (census tract shapefile in this case) has a column that must also appear in the Business dataset.
In this scenario, a logical choice would be the census tract id value. When the provider and geovariable are defined in VA, it is creating the equivalent of an SQL join between the two datasets. If they do not share a common column, the 'join' is not possible.
I hope this helps. If you have further questions, please reach out to Tech Support for additional assistance.
Hi Scott, I need to use a custom coordinates and custom region maps in the same map interactively (If I drill down in a region I can select some coordinates of that region) in SAS VA 7.5
Is this possible?
Thanks in Advance!
Hi Rigo, thanks for the question. Custom map providers were not fully supported until VA 8.2. However, there are work-arounds available for VA 7.x. See this blog post as an example. Please note that if attempting this work-around for VA 7.x, it requires modifying the original Geo lookup tables and must be done with caution. Done incorrectly, it could impact all Geo lookups, not just the custom provider.
For a geo hierarchy, each level of the hierarchy must be of the same type. So drilling into a region to see coordinates is not currently supported.
Hi Scott, thanks!!
Hi Scott,
Thank you so much for your quick reply. I don't know how to attach the data here. This is the frequency of the countries:
country Frequency
AUSTRALIA 6
CANADA 882
FRANCE 6
UK 4
US 37209
This is frequency of the states for US and Canada:
state Frequency
AB 259
AK 32
AL 25
AR 6438
AZ 128
BC 506
CA 151
CO 62
CT 13
DE 4
FL 108
GA 788
GU 2
HI 6
IA 29
ID 517
IL 28
IN 554
KS 2
KY 36
LA 195
MA 117
MD 66
ME 257
MI 49
MN 67
MO 61
MS 23
MT 10
NB 9
NC 98
NE 7
NH 21
NJ 36
NM 18
NV 236
NY 87
OH 610
OK 193
ON 83
OR 203
PA 591
RI 2
SC 31
SD 4
SK 5
TN 1582
TX 22959
UT 104
VA 595
VT 9
WA 13
WI 30
WV 3
WY 9
YT 1
I'll try your suggestion on creating two region map layers. I'm not too confident about it though since I just started trying out SAS VA a few days ago. 🙂
Thank you and have a great week!
Xueying
Hi Scott,
My data consists 5 countries: US, Canada, Mexico, UK, and Australia. I have States abbreviation to identify US and Canada's states. I'm able to create a US map using the US part from my data. My goal is to create a world map using my data, in which Mexico, UK, and Australia will only show the frequency for the whole country; US and Canada's map will show the frequency for each state. Is this possible?
Thanks!
Hi Xueying,
Thanks for the question! Without seeing the details of your data it is hard to definitively answer here. But my initial thought is that it may require two datasets in order to keep the identifier column unique across the desired regions since they are at different administration levels (ie state vs country). You may try creating a custom map template in Graph Builder with two region map layers for this. If this does not fit your solution, I would suggest reaching out to SAS Customer Support and they can help walk through this in more detail. https://support.sas.com/en/technical-support.html
I am getting difficulty in creating India map in SAS VA.
Hi Subhash,
Thanks for reaching out. Sorry you are having difficulties with your India map. Is there a particular step that you are having issues with? Can you provide a bit more information on the steps you are trying and/or errors you may be seeing? If you could also provide some detail on the shape and business data you are using for you map (ie. column names you are using for the join), that would be most helpful to assist in diagnosing the problem.
Thanks!
This is not a good example because of the following
"Since we are using the same dataset for the shape and business data"
In reality - they are not usually in the same data set - so how does one map the "actual data' after the boundaries are on the map ?
Hi Shaun,
I appreciate your feedback. You are correct, typically the region and business data will be in separate datasets. This is addressed at the top of the post. Unless you have GIS software or the provider uses an open data portal that allows viewing of the region shapes prior to download, it is a good idea to verify the shapes are accurate and meet your needs before adding in the second dataset of the business data. That would only further muddy the debugging process should an error occur in the workflow. Isolating one dataset at a time can be helpful. This post is an example of one way to do that.
To answer you question specifically, it depends upon your requirement for the final map. If you want a choropleth map, the business data and shape data must have a common variable that allows the two tables to be joined. Once joined, as shown in step 4 of the post, a Color role can then be assigned from the business data to show the distribution across the polygons defined in the shape data.
If you desire the business data to be displayed as a scatter or bubble plot overlaid on the regions, a specific VA object must be used. Auto-charting will not work in this situation. Depending upon your version of VA, you will need to use the 'Geo region-coordinate' graph type from the Object panel or create a new template in Graph Builder to support two geographic layers. Then, separate geographic variables must be created, one for the region layer and one for the scatter/bubble layer.
I hope this helps. If you have further questions, please reach out to Tech Support for additional assistance.
I have .shp files, but I can't find out what the unique identifier is and I'm not having any luck finding a viewer that lets me see the data so I can find out what value in put into the %shpimport code, specifically the below.
proc mapimport out=
datafile=;
/* unique identifier in shapefile */
id ;
run;
Thanks for the question Andrea! What you describe can be a challenging aspect of creating a custom region provider. But there is hope! There is a free online resource that allows you to view shapefiles and their attributes. It can be found at: https://mapshaper.org/
To use, simply drag-and-drop your zip file or individual files associated with your shapefile and click Import. If selecting individual files, include at a minimum the .shp, .prj, and the .dbf files. Once the shapefile is displayed, click the large arrow icon on the right of the browser and select 'inspect attributes'. Now as you mouse-over the individual elements of your shapefile, a dialog box will appear with all shapefile attributes and the values for the currently selected element.
Your business data must contain one of these fields in order to join them together for the custom map provider. I hope this helps!