By default, SAS Visual Analytics 7.4 supports country and state level polygons for regional geomaps. In SAS Visual Analytics 7.4, custom shape files are now supported, as well. This means that if a site has their own custom polygon data that defines custom regions, it’s possible to create a region geomap that displays those regions.
Implementing the process requires completing some preparatory steps, explicitly execution of some SAS code, but the steps are explained in Appendix 2 of the SAS Visual Analytics 7.4: Administration Guide. The SAS program that completes the steps is provided for download at http://support.sas.com/rnd/datavisualization/vageo/va74polygons.sas.
Two examples using the program are provided in Appendix 2 for US counties and German provinces. The instructions in Appendix 2 assume that the custom polygon data is provided in ESRI shape file format, which is likely the most common use-case. The site will need access to a SAS programming environment and SAS/GRAPH software, and whoever completes the process will need access to the SAS Visual Analytics configuration directory and the ability to restart services—so an administrator-type person will be required.
One common request is to provide a regional geomap, where the regions are site-defined groups of states or provinces of a country. In this example problem, the site has sales data for each sales region in the US and would like to display a geo map of the regions.
For this type of region/province example, you will likely be able to use one of the maps already provided by SAS in the MAPSGFK library to produce your region boundaries. For more information on the datasets in the MAPSGFK library, see this paper.
The MAPSGFK.US_STATES dataset contains the data required to overlay all states of the US on a VA region geomap and has these columns:
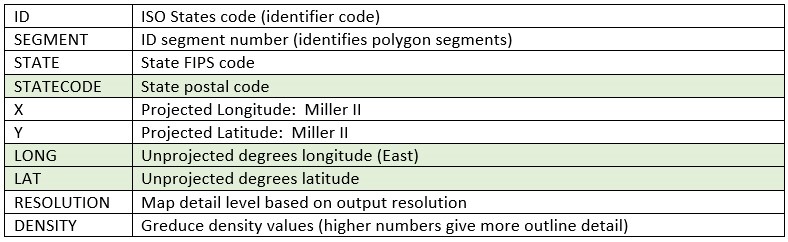
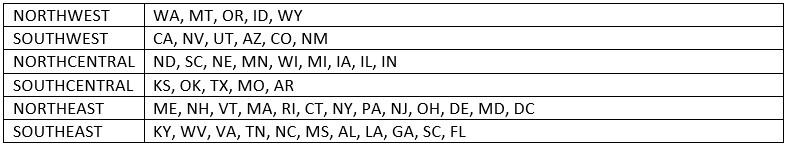
The highlighted columns, STATECODE, LONG, and LAT will be particularly useful, but first, the sales region (REGION) column and values must be added using simple data step code. The unnecessary FIPS code (STATE) can be dropped in the same DATA step. Note that the region values are assigned in upper case, as these will later be converted to ID values, which VA expects to be in upper case.
data regions; length region $ 12; drop state; set mapsgfk.us_states; if statecode in ('AK','HI','PR') then delete; else if statecode in ('WA','MT','OR','ID','WY') then region='NORTHWEST'; else if statecode in ('CA','NV','UT','AZ','CO','NM') then region='SOUTHWEST'; else if statecode in ('ND','SD','NE','MN','WI','MI','IA','IL','IN') then region='NORTHCENTRAL'; else if statecode in ('KS','OK','TX','MO','AR') then region='SOUTHCENTRAL'; else if statecode in ('ME','NH','VT','MA','RI','CT','NY','PA','NJ','OH','DE', 'MD','DC')then region='NORTHEAST'; else if statecode in ('KY','WV','VA','TN','NC','MS','AL','LA','GA','SC','FL') then region='SOUTHEAST'; run; |
The data is then sorted by the REGION values, a requirement of the SAS/GRAPH GREMOVE procedure, which is used to remove the internal state boundary data points, leaving the region boundary points only.
proc sort data=regions; by region; proc gremove data=regions out=mapscstm.regions1; by region; id statecode; run; |
To complete the process, since the LAT and LONG values are already in the form that VA needs (unprojected) and we are using a SAS dataset rather than the ESRI shape file format, we’ll only use a part of the code from the downloadable program mentioned at the beginning of the blog.
First, create a mapscstm directory under /SASHome/SASFoundation/9.4 to store the custom polygon dataset. Make sure that the library is accessible to the SAS session by including a libname statement in the appserver_autoexec_usermods.sas file, found in config/Lev1/SASApp, and then restarting the Object Spawner.
Example:
libname MAPSCSTM “SASHome/SASFoundation/9.4/mapscstm”; |
Tip: Be sure to back up the original ATTRLOOKUP and CENTLOOKUP datasets before running any additional code, as you will be modifying the originals.
To complete creation of the polygon dataset, you will need to execute only a part of the downloadable program to:
• Make sure that your polygon dataset has all of the columns expected by SAS Visual Analytics.
• Add the region attributes to the ATTRLOOKUP.
• Add the region center point locations to the CENTLOOKUP dataset.
%let REGION_LABEL=USRegions; /* The label for the custom region */ %let REGION_PREFIX=R1; /* unique ISO 2-Letter Code */ %let REGION_ISO=000; /* unique ISO Code */ %let REGION_DATASET=MAPSCSTM.REGIONS1; /* Polygon data set to be created - be sure to use suffix "1" */ |
Note that the downloadable program includes additional macro assignments and additional code, but since our data is already in the form of a SAS dataset, rather than ESRI shape file format, we won’t be using all of the code.
The following datastep adds the necessary columns/values to the polygon dataset so that the form of the data is what is expected by VA. Note that the LAT and LONG columns are already in unprojected form, so we just assign the same values to X and Y. (VA doesn’t actually use the X,Y columns from the polygon dataset.)
data ®ION_DATASET.; set ®ION_DATASET.; where density <= 3; id=region; idname=region; x=long; y=lat; ISO = "®ION_ISO."; RESOLUTION = 1; LAKE = 0; ISOALPHA2 = "®ION_PREFIX."; AdminType = "regions"; keep ID SEGMENT IDNAME LONG LAT X Y ISO DENSITY RESOLUTION LAKE ISOALPHA2 AdminType; run; |
Then PROC SQL steps are executed to add rows relative to the custom polygons to the ATTRLOOKUP and CENTLOOKUP datasets:
This step adds the USRegions row to ATTRLOOKUP:
proc sql; insert into valib.attrlookup values ( "®ION_LABEL.", /* IDLABEL=State/Province Label */ "®ION_PREFIX.", /* ID=SAS Map ID Value */ "®ION_LABEL.", /* IDNAME=State/Province Name */ "", /* ID1NAME=Country Name */ "", /* ID2NAME */ "®ION_ISO.", /* ISO=Country ISO Numeric Code */ "®ION_LABEL.", /* ISONAME */ "®ION_LABEL.", /* KEY */ "", /* ID1=Country ISO 2-Letter Code */ "", /* ID2 */ "", /* ID3 */ "", /* ID3NAME */ 0 /* LEVEL (0=country level, 1=state level) */ ); quit; |
This step adds a row to ATTRLOOKUP for each individual region:
proc sql; insert into valib.attrlookup select distinct IDNAME, /* IDLABEL=State/Province Label */ ID, /* ID=SAS Map ID Value */ IDNAME, /* IDNAME=State/Province Name */ "®ION_LABEL.", /* ID1NAME=Country Name */ "", /* ID2NAME */ "®ION_ISO.", /* ISO=Country ISO Numeric Code */ "®ION_LABEL.", /* ISONAME */ trim(IDNAME) || "|®ION_LABEL.", /* KEY */ "®ION_PREFIX.", /* ID1=Country ISO 2-Letter Code */ "", /* ID2 */ "", /* ID3 */ "", /* ID3NAME */ 1 /* LEVEL (1=state level) */ from ®ION_DATASET.; quit; |
This step calculates and adds the central location point for each of the regions to the CENTLOOKUP dataset. The site data contains only the 48 contiguous states (no Alaska or Hawaii). If Alaska and Hawaii had been included, a different algorithm would need to be used to calculate the central location.
proc sql; /* Add custom region */ insert into valib.centlookup select distinct "®ION_DATASET." as mapname, "®ION_PREFIX." as ID, avg(x) as x, avg(y) as y from ®ION_DATASET.; /* Add custom provinces */ insert into valib.centlookup select distinct "®ION_DATASET." as mapname, ID as ID, avg(x) as x, avg(y) as y from ®ION_DATASET. group by id; quit; |
After executing the code above, you will need to restart the Web Application server, so that SAS Visual Analytics has access to the new polygons.
Code is also included in the downloadable program to create a dataset for validating your results. The validate dataset includes a column for the ID and IDNAME of the regions, in addition to two randomly calculated measures. In our case, we will instead just use our original REGIONSALES dataset containing the regional sales data.
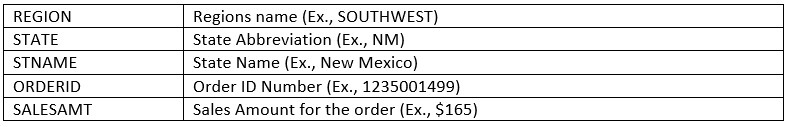
1. Sign into SAS Visual Analytics and create a new exploration with data source REGIONSALES.
2. Create a Geo data item from State: Right-click Regions, select Geography?Subdivision(State, Province) Names. From the Country or Region drop-down list, select the USRegions region label.
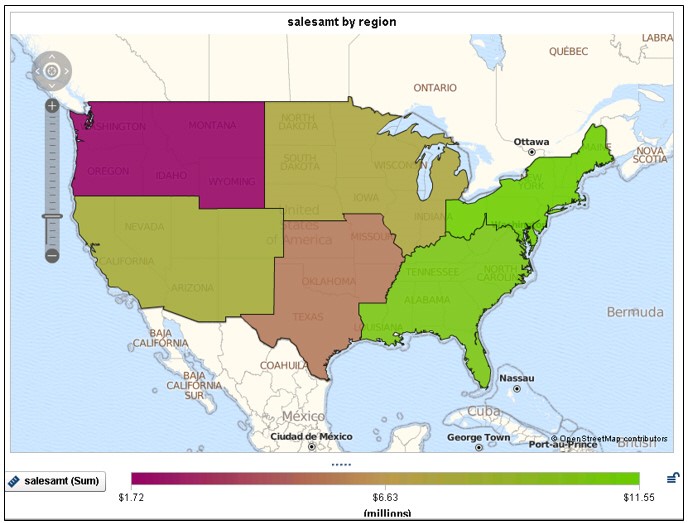
3. Create a geo map visualization. Select Regions for the map style, Regions for the Geography role, and salesamt for the Color role.
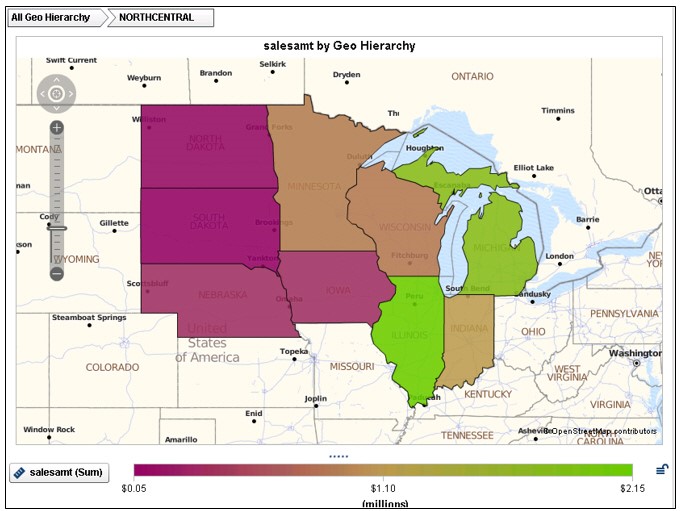
Your regions should display, similar to this:
You can also include the region data item in a hierarchy with the state data item to produce a drill-down region map:
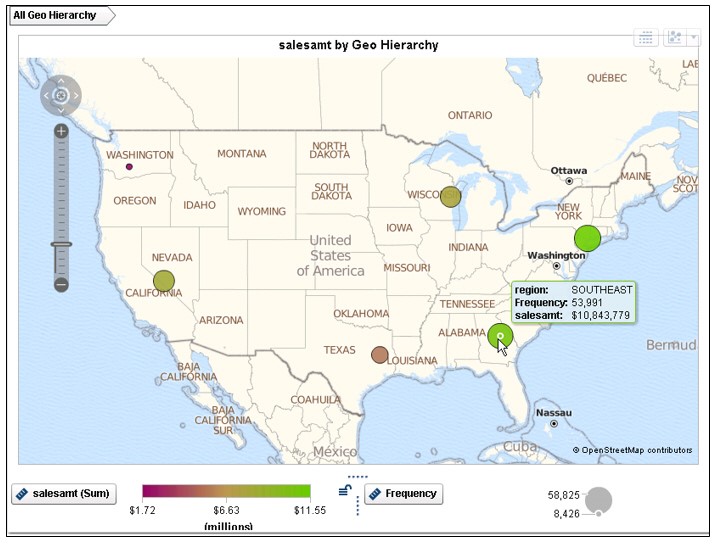
Or a bubble or coordinate map:
I hope this example has been helpful to users of SAS Visual Analytics 7.4. In my next blog, you will see that this process is tremendously simplified by new mapping features in SAS Visual Analytics 8.2.