In my last article, I worked with an example of using custom polygon data to create a regional geo map in SAS Visual Analytics 7.4. In this article, I will use almost the same example to illustrate the ease of implementing custom polygons to produce the same regional map in SAS Visual Analytics 8.2.
In this example, as in my last blog, the site has sales data for each sales region in the US and would like to display a geo map of the regions.
The six sales regions are:
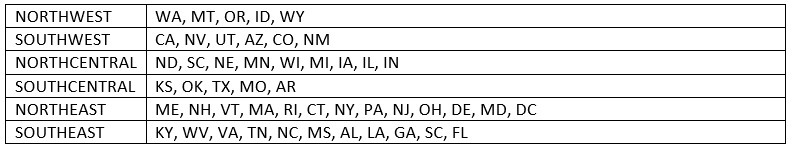
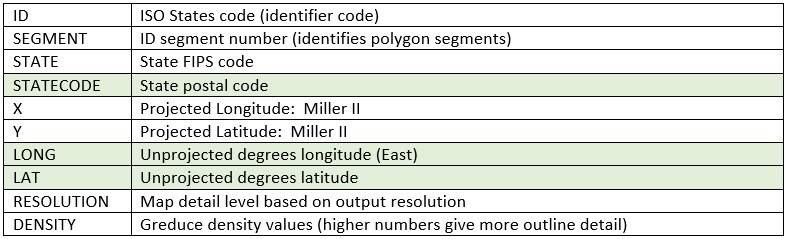
We will again start with the MAPSGFK.US_STATES dataset, which contains the data required to overlay all states of the US on a VA region geomap and has these columns:
As in my last post, we will add the sales regions (REGION) column and values using data step code, and then use GREMOVE to remove the state boundaries, leaving the region boundary points. For a look at that code, see my previous blog.
The following datastep adds the necessary columns/values to the polygon dataset so that the form of the data is what is expected by VA. Note that the LAT and LONG columns are already in unprojected form, so we just assign those values to Y and X, so our column names will more closely match what we will see in the VA interface when creating the geographic data item. We also create a SEQUENCE column, required by VA 8.2, using the values of the internal variable, _n_.
data mydata.regions; set mydata.regions; sequence=_n_; id=region; x=long; y=lat; keep ID SEQUENCE SEGMENT X Y ; run; |
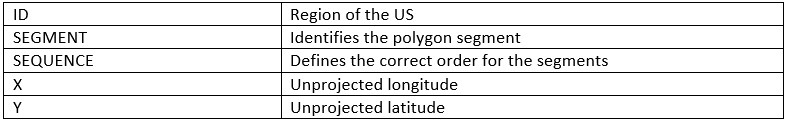
The polygon table, REGIONS, now has the following columns.
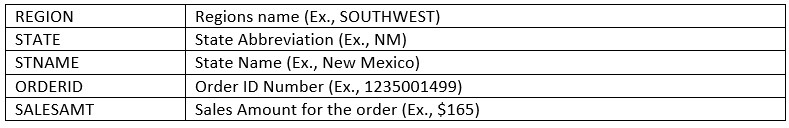
The dataset containing the region and measure data, REGIONSALES contains these columns:
Both datasets should be loaded into memory. Sign in to SAS Visual Analytics – Explore and Visualize Data and create a new report with data source REGIONSALES.
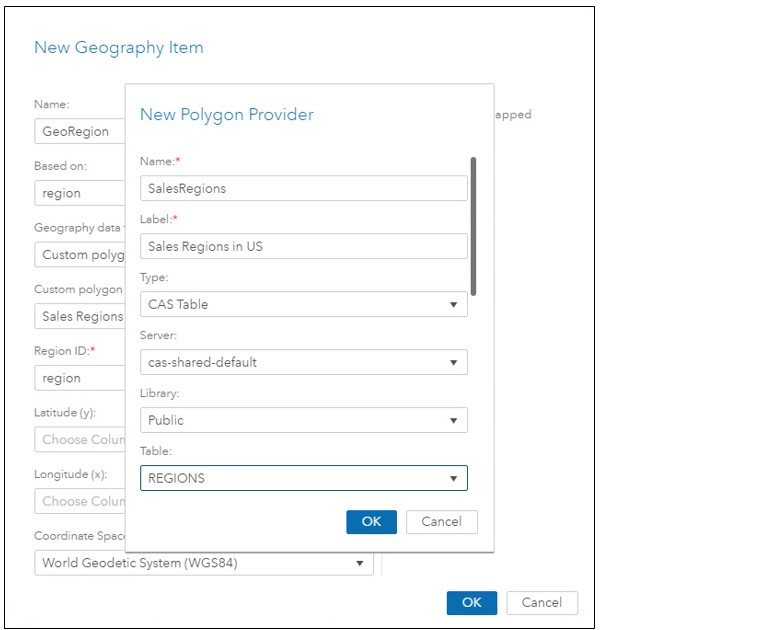
Create a new Geography data item from REGION as shown below, also specifying a New Polygon Provider with values shown on the next several screen shots. Give the new provider a name and label, and specify the CAS server, library, and table name.
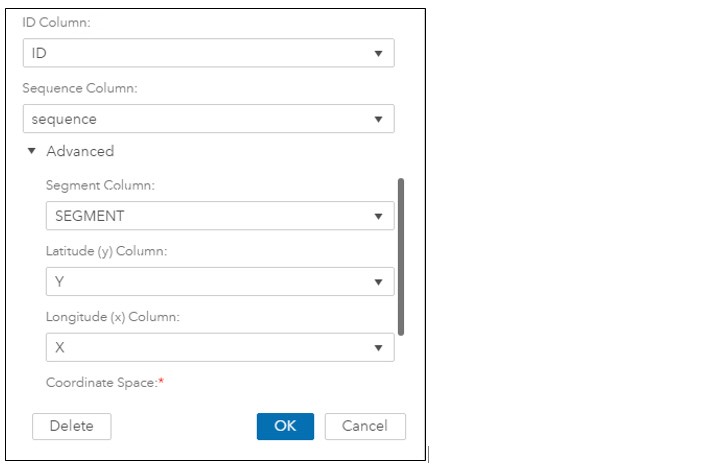
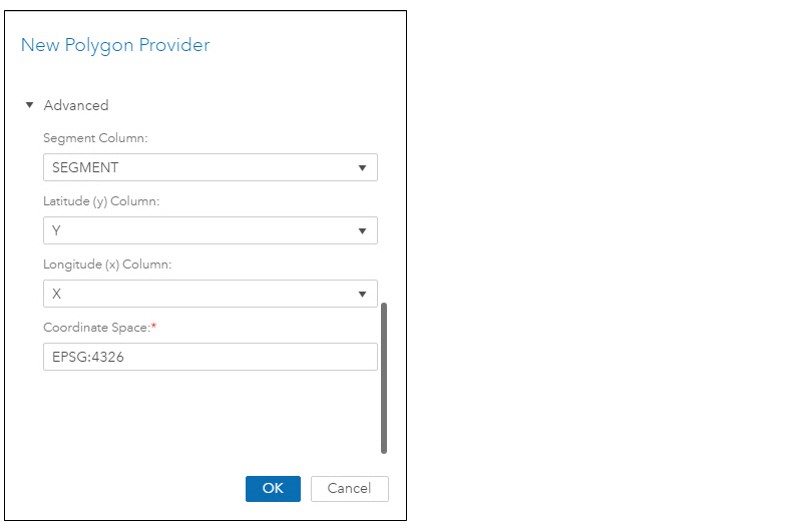
Scroll down to add the ID, Sequence, Segment, latitude and longitude columns.
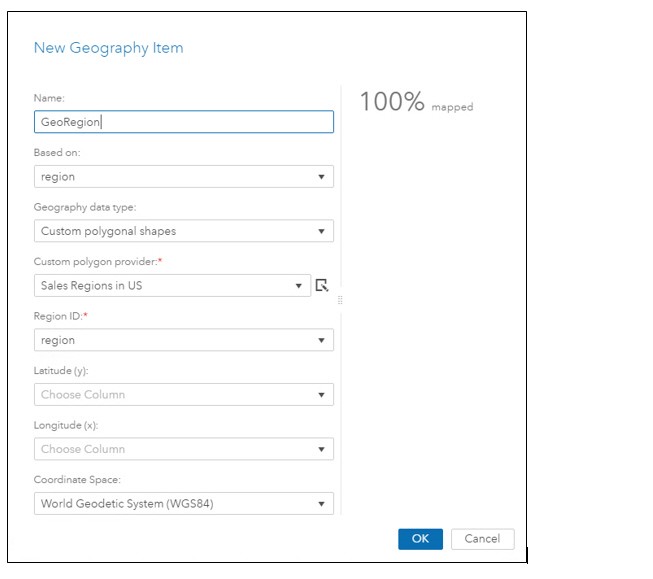
The new geography data item, after clicking OK:
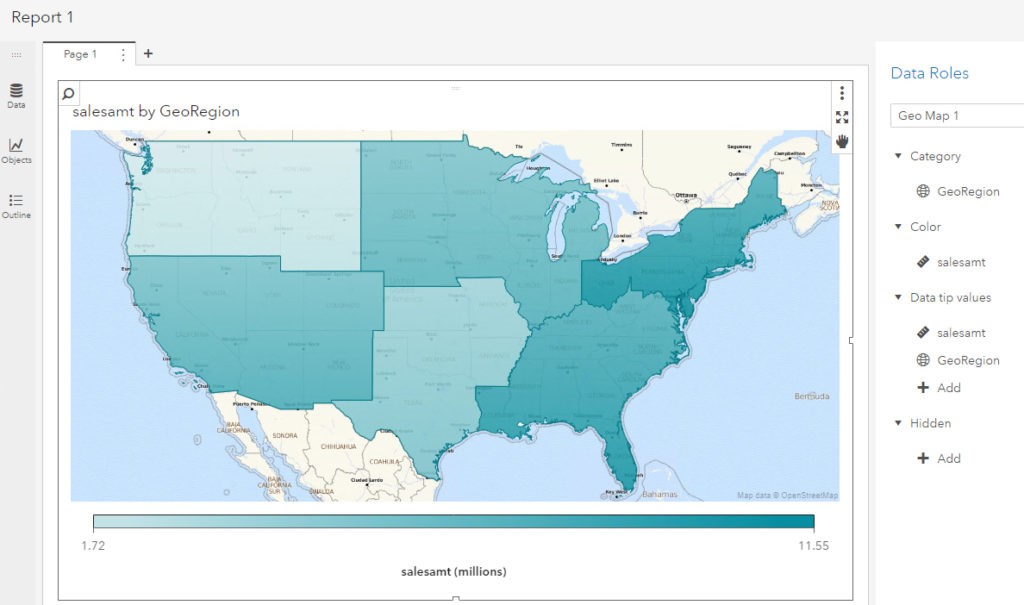
Now create a Geo Map of type Regions as shown:
Please see the documentation here for additional details, specifically the heading Create a Geography Data Item By Using Custom Polygonal Shapes.