Community detection has been used in multiple fields, such as social networks, biological networks, tele-communication networks and fraud/terrorist detection etc. Traditionally, it is performed on an entity link graph in which the vertices represent the entities and the edges indicate links between pairs of entities, and its target is to partition an entity-link graph into communities such that the links within the community subgraphs are more densely connected than the links between communities. Finding communities within an arbitrary network can be a computationally difficult task. The number of communities, if any, within the network is typically unknown and the communities are often of unequal size and/or density. Despite these difficulties, however, several methods for community finding have been developed and employed with varying levels of success.[1] SAS implements the most popular algorithms and SAS-proprietary algorithms of graph and network analysis, and integrated them with other powerful analytics into SAS Social Network Analysis. SAS graph algorithms are packaged into PROC OPTGRAPH, and with it you can detect communities from network graph.
In text analytics, researchers did some explorations in applying community detection on textual interaction data and showcased its effectiveness, such as co-authorship network, textual-interaction network, and social-tag network etc.[2] In this post, I would like to show you how to cluster papers based on the keyword link graph using community detection.
Following steps that I introduced in my previous blog, you may get paper keywords with SAS Text Analytics. Suppose you already have the paper keywords, then you need to go through the following three steps.
Step 1: Build the network.
The network structure depends on your analysis purpose and data. Take the paper-keyword relationships, for example, there are two ways to construct the network. The first method uses papers as vertices and a link occurs only when two papers have a same keyword or keyword token. The second method treats papers, keywords and keyword tokens as vertices, and links only exist in paper-keyword pairs or paper-keyword_token pairs. There is no direct link between papers.
I compared the community detection results of the two methods, and finally I chose the second method because its result is more reasonable. So in this article, I will focus on the second method only.
In addition, SAS supports weighted graph analysis, in my experiment I used term frequency as weight. For example, keywords of paper 114 are “boosting; neural network; word embedding”. After parsing the paper keywords with SAS Text Analytics, we get 6 terms. They are “boost”, “neural network”, “neural”, “network”, “word”, and “embedding”. Here I turned on stemming and noun group options, and honored SAS stoplist for English. The network data of this paper as Table-1 shows.
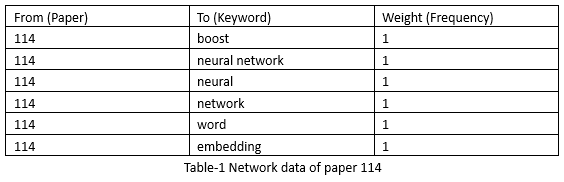
In the text parse step, I set term weight and cell weight with none, because community defection depends on link density and term frequencies are more effective than weighted values in this tiny data. As the table-1 shows, term frequency is small too, so no need to use log transform for cell weight.
Step 2: Run community detection to clustering papers and output detection result.
There are two types of network graphs. They are directed graph and undirected graph. In paper-keyword relationships, direction from paper to keyword or versus does not make difference, so I chose undirected graph. PROC OPTGRAPH implements three heuristic algorithms for finding communities: the LOUVAIN algorithm proposed in Blondel et al. (2008), the label propagation algorithm proposed in Raghavan, Albert, and Kumara (2007), and the parallel label propagation algorithm developed by SAS. The Louvain algorithm aims to optimize modularity, which is one of the most popular merit functions for community detection. Modularity is a measure of the quality of a division of a graph into communities. The modularity of a division is defined to be the fraction of the links that fall within the communities minus the expected fraction if the links were distributed at random, assuming that you do not change the degree of each node. [3] In my experiment, I used Louvain.
Besides algorithm, you also need to set resolution value. Larger resolution value produces more communities, each of which contains a smaller number of nodes. I tried three resolution values: 0.5, 1, 1.5, and finally I set 1 as resolution value because I think topic of each community is more reasonable. With these settings, I got 18 communities at last.
Step 3: Explore communities visually and get insights.
Once you have community detection result, you may use Network Diagram of SAS Visual Analytics to visually explore the communities and understand their topics or characteristics.
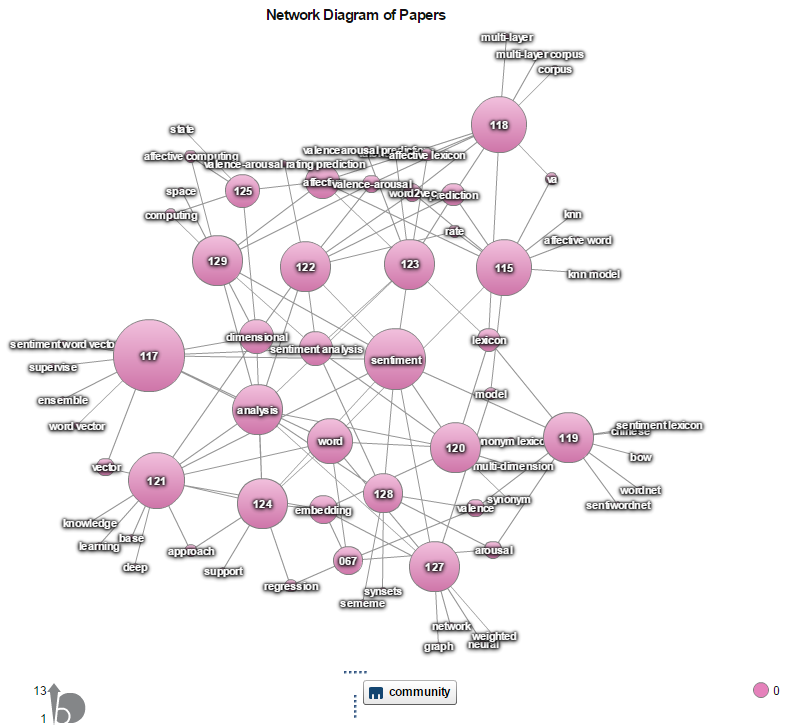
Take the largest community as an example, there are 14 papers in this community. Nodes with numbers notated are papers, otherwise they are keyword tokens. Node size is determined by sum of link weight (term frequency), and node color is decided by community value. From Figure-1, you may easily find out its topic: sentiment, which is the largest node in all keyword nodes. After I went through the conference program, I found they all are papers of IALP 2016 shared task, which is targeted to predict valence-arousal ratings of Chinese affective words.
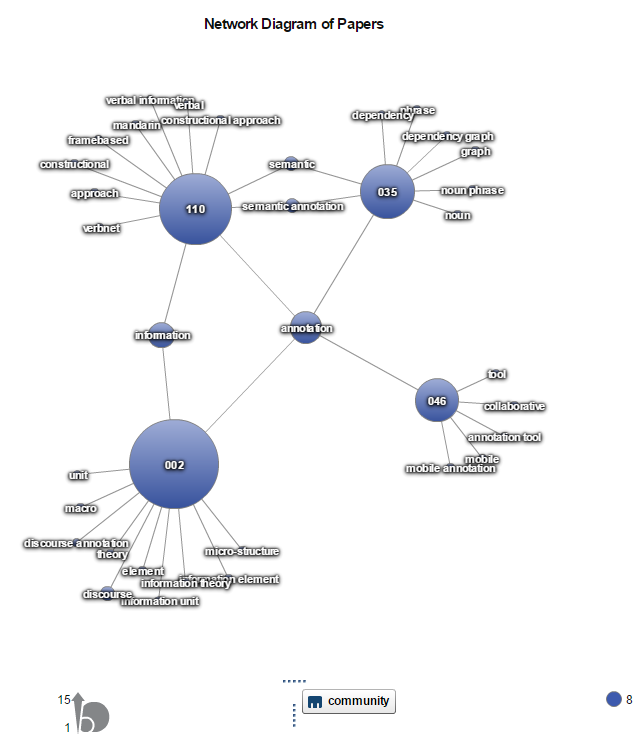
Another example is community 8, and its topic terms are annotation and information.
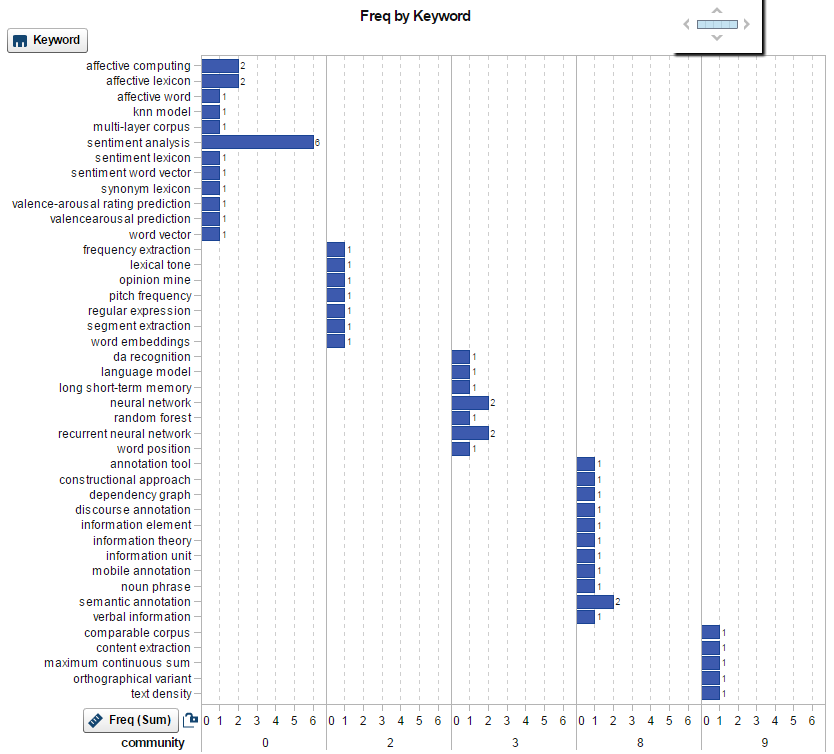
Simultaneously the keywords were also clustered, and the keyword community may be used in your search engine to improve the keyword-based recommendation or improve the search performance by retrieving more relevant documents. I extracted the keywords (noun group only) of the top 5 communities and displayed them with SAS Visual Analytics. The top 3 keywords of community 0 are: sentiment analysis, affective computing, and affective lexicon, which are very close from semantic perspective. If you have more data, you may get better results than mine.
If you are interested in this analysis, why not try it with your data? The SAS scripts for clustering papers as below.
* Step 1: Build the paper-keyword network; proc hptmine data=outlib.paper_keywords; doc_id documentName; var keywords; parse notagging termwgt=none cellwgt=none stop=sashelp.engstop outterms=terms outparent=parent reducef=1; run;quit; proc sql; create table outlib.paper_keyword_network as select _document_ as from, term as to, _count_ as weight from parent left join terms on parent._termnum_ = terms.key where parent eq .; quit; * Step 2: Run community detection to clustering papers; * NOTE: huge network = low resolution level; proc optgraph loglevel = 1 direction=undirected graph_internal_format = thin data_links = outlib.paper_keyword_network out_nodes = nodes ; community loglevel = 1 maxiter = 20 link_removal_ratio = 0 resolution_list = 1 ; run; quit; proc sql; create table paper_community as select distinct Paper_keywords.documentName, keywords, community_1 as community from outlib.Paper_keywords left join nodes on nodes.node = Paper_keywords.documentName order by community_1, documentName; quit; * Step 3: Merge network and community data for VA exploration; proc sql; create table outlib.paper_community_va as select paper_keyword_network.*, community from outlib.paper_keyword_network left join paper_community on paper_keyword_network.from = paper_community.documentName; quit; * Step 4: Keyword communities; proc sql; create table keyword_community as select * from nodes where node not in (select documentName from outlib.paper_keywords) order by community_1, node; quit; proc sql; create table outlib.keyword_community_va as select keyword_community.*, freq from keyword_community left join terms on keyword_community.node = terms.term where parent eq . and role eq 'NOUN_GROUP' order by community_1, freq desc; quit; |
References
[1]. Communities in Networks
[2]. Automatic Clustering of Social Tag using Community Detection
[3]. SAS(R) OPTGRAPH Procedure 14.2: Graph Algorithms and Network Analysis