 Report data shared by educational institutions, government agencies, healthcare organizations, and human resource departments can contain sensitive or confidential data. Data in such reports are suppressed selectively to protect the identities of individuals or to prevent the report’s audience from easily inferring individual values. The Data Suppression feature in SAS Visual Analytics 8.2 is easy to use when you need to selectively suppress aggregated data values in your reports.
All you need to do is create a calculated data item for Data Suppression and apply it to a report object such as a list table or a crosstab. You could apply Data Suppression to a variety of report objects, but suppressing data for cells in either list tables or crosstabs is a common practice.
Here are a couple of examples where data suppression is applicable:
- Universities and schools that release data on their students often use a cell threshold value in their report data to protect the risk of identifying specific students when the number of students in a class falls below the defined threshold value, and individual values for test scores or other criteria such as race can be easily determined by looking at the data.
- In official reports with federal statistics that are provided by the Centers for Disease Control and Prevention in the U.S., certain data cells in the reports are suppressed to protect the confidentiality of patients and eliminate the risk of disclosing their identity. Patient data in such reports are suppressed by using a cell suppression threshold value of 16.
Before we jump into data suppression in SAS Visual Analytics, a quick note on understanding two kinds of data suppression.
Data Suppression by Using the withComplement Option
When a calculated data item is created for Data Suppression, SAS Visual Analytics applies the withComplement option by default, and an additional complementary value is hidden randomly (by displaying an asterisk) when you suppress the data for a single aggregated value. This is done to prevent easy inference of the data values by viewing the total, subtotals, or other cell values.
Data Suppression by Using the withoutComplement Setting
If a calculated data item for Data Suppression is created by using the withoutComplement option, SAS Visual Analytics suppresses (by using an asterisk) only the aggregated data values that you chose to suppress, and no other additional complementary values are hidden with asterisks.
Let’s Do It
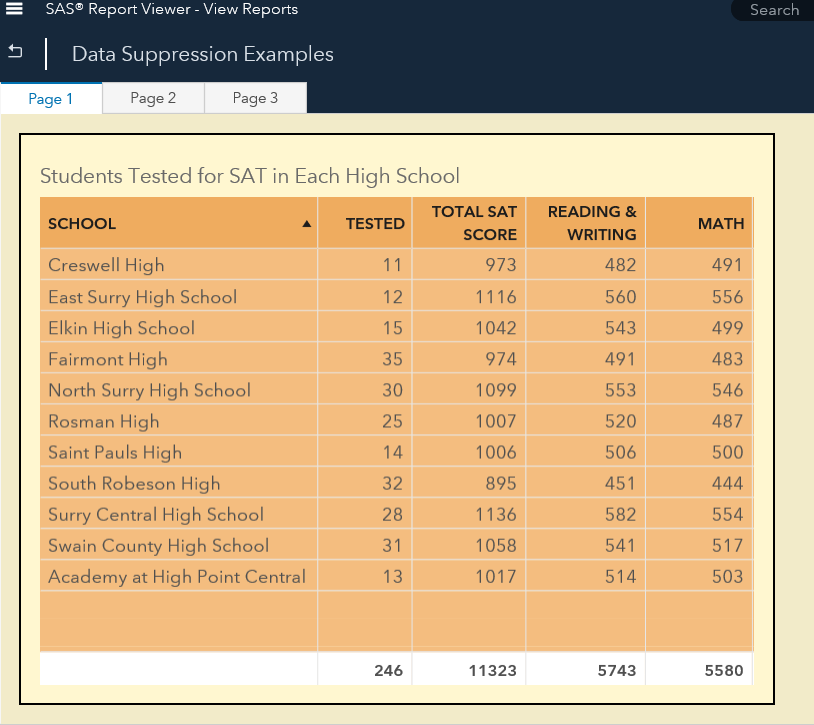
As an instructional exercise for data suppression, I chose a small subset of the data for high school students and their SAT test scores in the state of the North Carolina. I added three list tables to my report. My first list table has no data suppression (so we can see the data that I intend to suppress). My second list table will have data suppression without complementary values, and my third list table will have data suppression with complementary values.
In the first list table, the TESTED column shows the number of students that took the SAT test in each high school. If 14 or fewer than 14 students took the SAT test, I want to suppress the display of the number of students in the TESTED column for that high school.
Create the Calculated Data Item for Data Suppression Without Complementary Values
1. In SAS Visual Analytics, I click on Data, right click on TESTED (the measure upon which my calculated item for data suppression will be created), and select New calculation.
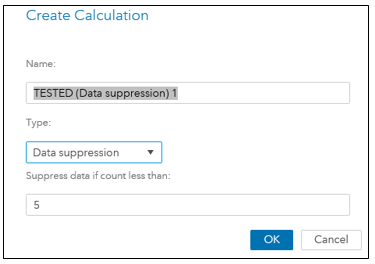
2. In the Create Calculation dialog, I change the Type to Suppression. By default, SAS Visual Analytics fills in the default value of 5 observations for the Suppress data if count less than: parameter field. I plan to change this value and the condition; for now, I keep the default value so I click OK.
Edit the Calculated Data Item for Data Suppression Without Complementary Values
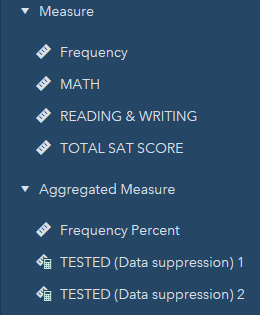
1. To edit the calculated item that I just created, I click on Data, right click on the calculated item I just created (TESTED (Data suppression) 1 and choose Edit.
2. In the Visual mode, I see the calculated item for data suppression.
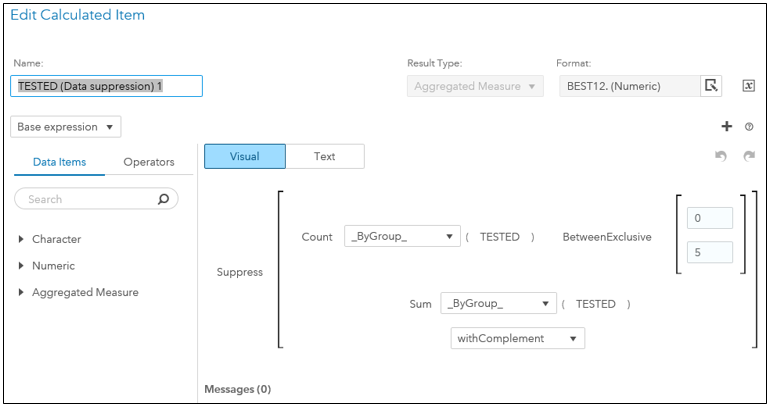
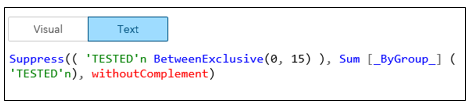
3. I click on Text because I want to suppress low values for the TESTED column (which is the number of students that took the test) to 14 and below, and not the number of observations (Frequency) that are suppressed by default. So I edited the condition for data suppression and saved it:
4. My second list table already has roles assigned to it. Now I added the newly created calculated data item: TESTED (Data Suppression) 1.
This List Table now shows asterisks for values suppressed in the TESTED column for any high school where 14 or fewer than 14 students took the SAT test.
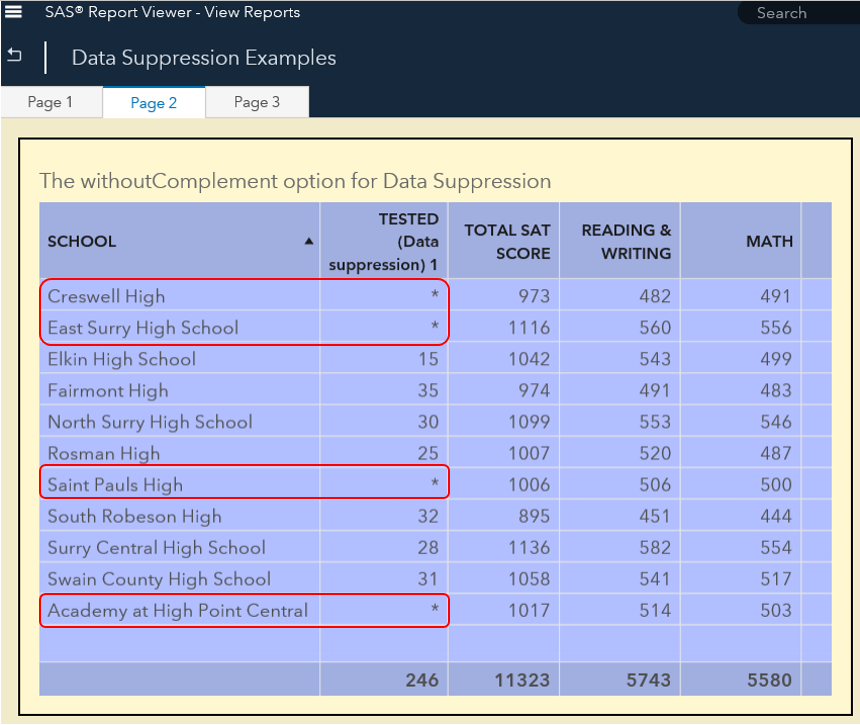
All values for the TESTED measure upon which my condition is based are replaced with asterisk characters. It is important to note that although the suppressed values for TESTED are hidden from view with asterisks, they are still present in the data source. Therefore, I should hide the original measure (in this case, TESTED) from view in the report to prevent the accidental use of the TESTED measure for other report objects in the same report – (we’ll take a quick look at that at the end).
Create the Calculated Data Item for Data Suppression With Complementary Value
1. I click on Data, right click on TESTED, and select New calculation.
2. In the Create Calculation dialog, I change the Type to Suppression and click OK to save this new calculated item.
Edit the Calculated Data Item for Data Suppression With Calculated Value Suppression
1. To edit the calculated item that I just created, I right click on the calculated item for data suppression and choose Edit.
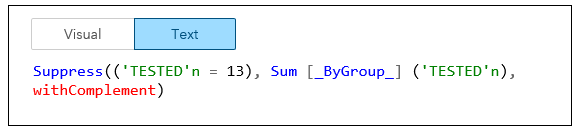
2. In the Edit Calculated Item dialog, I click Text to see the text version of the calculated data item, and I edited the condition to ensure that data is suppressed for high schools where the total number of students tested equals 13.
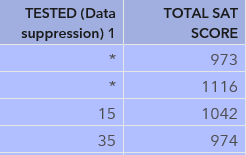
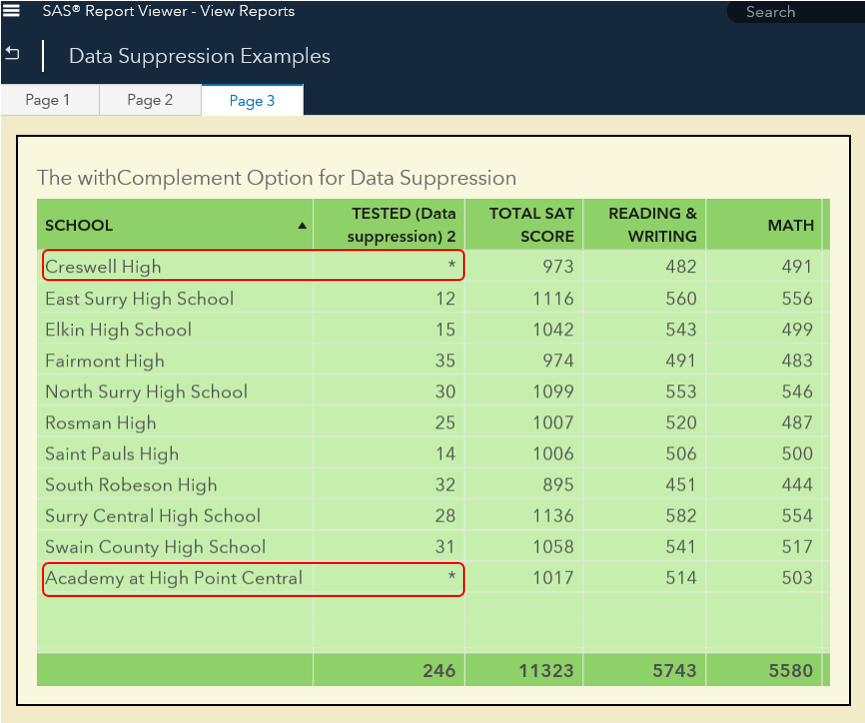
My List Table now shows values suppressed in the TESTED column for the high school where 13 students took the SAT test. In addition, another value in the TESTED column is also suppressed randomly by SAS Visual Analytics – in this case, it was for Creswell High School. The random suppression of another value is done to prevent your audience from looking at the Totals column and guessing the number of students that took the SAT test in each high school.
Be sure to follow the three best practices that are described for data suppression in the SAS Visual Analytics 8.2 documentation: Working with Report Data. It is important to note that although the suppressed values for TESTED are hidden from view with asterisks, they are still present in the data source. To avoid the possibility of using the measure upon which the calculated item for data suppression was created, it is best to hide the measure. This ensures that you or other report designers do not accidentally reuse the original measure for other objects in the report.
To hide the measure TESTED, I chose the TESTED measure in the Data Pane, right clicked on it, and chose Hide.

The TESTED measure does not display anymore.
For details on how to show or hide data items, see Working with Report Data.

2 Comments
Hello, I am having issues trying out this new functionality.
1. In the edit mode for a recently created report, I selected the Data tab and right clicked on a measure. The options does not include new calculation.
2. So I tried going to the drop down area under the data source area and selected "New Calculated Item". But it does not have the option to select suppression as the type. I tried typing in the syntax provided above but there is an error message "Unknown function: Suppress".
Can you please provide additional guidance?
Thank you, Lavanya, for sharing this important new functionality available in SAS VA 8.2. I would like to complement your post with a reference to my blog post Automatic data suppression in SAS reports that describes in detail the complementary suppression algorithm and its SAS code implementation. I am also presenting a paper at SAS Global Forum 2018 "Implementing Privacy Protection-Compliant SAS® Aggregate Reports", and I am going to reference your blog post in my presentation.