Learn how an intern integrated SAS Viya® and open-source code (Python) into a Machine Learning project to combine their strengths within the context of predictive modeling, and to show off the variety of ways this integration can be accomplished.

Learn how an intern integrated SAS Viya® and open-source code (Python) into a Machine Learning project to combine their strengths within the context of predictive modeling, and to show off the variety of ways this integration can be accomplished.

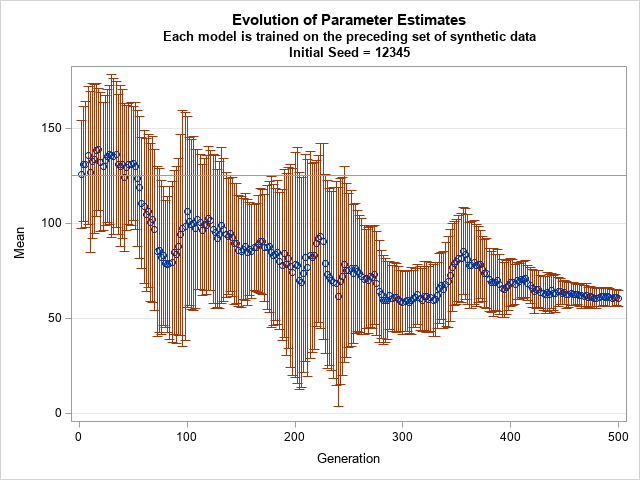
An article published in Nature has the intriguing title, "AI models collapse when trained on recursively generated data." (Shumailov, et al., 2024). The article is quite readable, but I also recommend a less technical overview of the result: "AI models fed AI-generated data quickly spew nonsense" (Gibney, 2024). The Gibney

Health care payers stand at a crucial moment in balancing expenses with the imperative of providing high-quality care. Rising medical expenses – driven by new technologies, aging populations and the surge in chronic diseases – present an ongoing challenge. Whether they are insurance companies, government programs or employers, payers must