Report designers often discover after aggregating data by groups in the Visual Analytics Designer that it would also be nice to see additional aggregations of the data, for example, a maximum or minimum of that sum across groups. This means creating an ‘aggregation of an aggregation.’ If you plan your report objectives in advance of loading your data, you can do this by creating an aggregation initially in the Visual Data Builder, rather than the Designer. And in many cases, it’s possible to get the desired report results by simply loading a small additional table to memory.
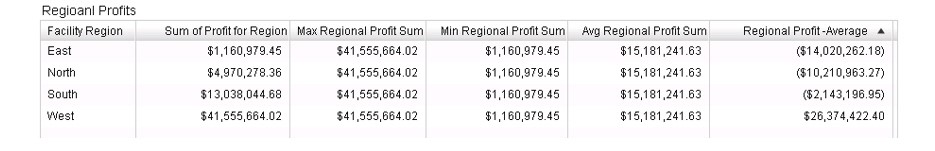
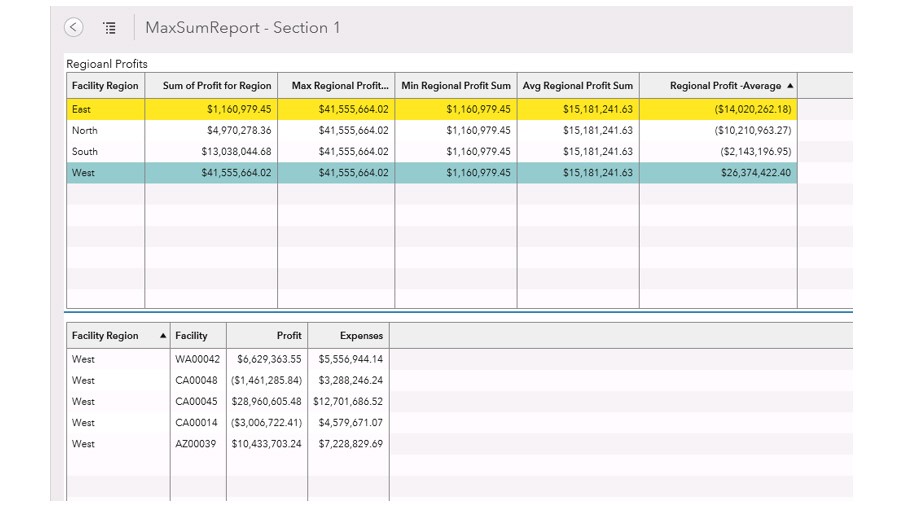
Here’s an example of a report with a sum aggregation on the profit measure and Facility Region as the category data item. The report also shows the maximum, minimum, and average of the regional profit values, along with the difference between each region’s profit sum and the average. It’s possible to assign a SUM aggregation to the Profit measure, but the challenge appears when trying then to create a MAX aggregation across the regions.
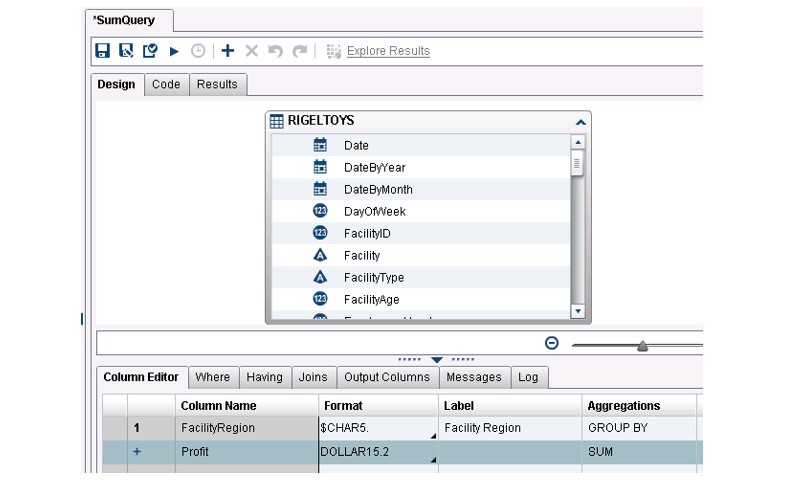
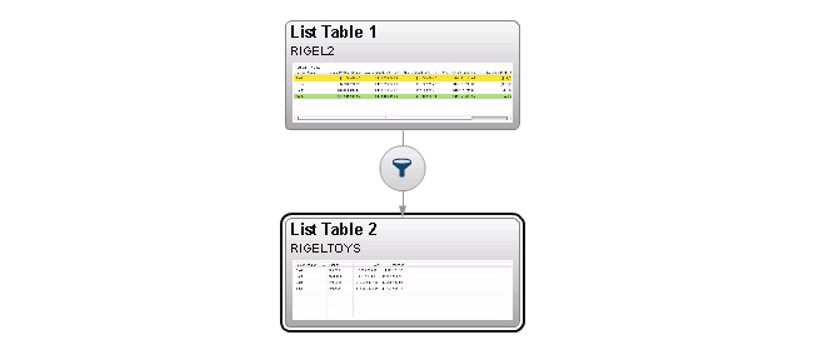
If you have awareness of the need for this type of report prior to loading the data, you can easily load a much smaller version of the data with the Profit data item already pre-aggregated. The data builder query, shown below, creates and loads a file containing only the FacilityRegion as a GROUP BY column and the Profit column as a SUM aggregation.
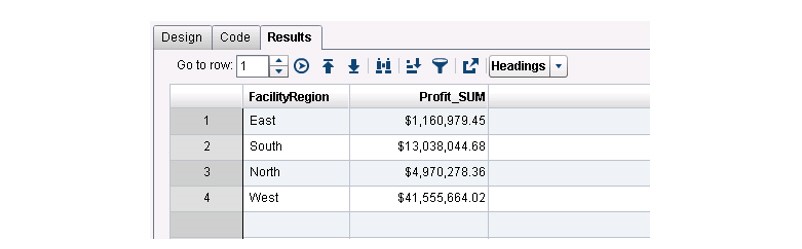
In the designer, for reporting purposes, the Profit_SUM data item is renamed to Sum of Profit for Region.

Now the Sum of Profit for Region data item can be used to calculate these aggregated measures: Max Regional Profit Sum, Min Regional Profit Sum, and Avg Regional Profit Sum, using the formulas shown below:

Once you have the Avg Regional Profit Sum calculation, you can create the additional aggregated measure, Regional Profit – Average:

So, this is a list table displaying all of the information that was derived from the two columns and four rows of data.

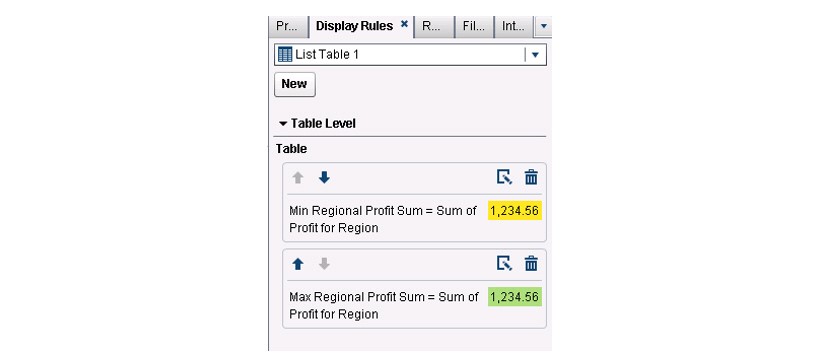
To emphasize the region with the maximum profit and minimum profit, you may want to add the following display rules.
And since you have the original larger table loaded as well, you can add an additional data source and some interactions, so that the user can click on a row to view more detail data corresponding to each region of interest.
Now, for example, the user can see what facilities contributed to the max value for the Western region, and the corresponding Expenses as well!
So, although it may not be practical to pre-aggregate the values of every measure in your data, sometimes pre-aggregating and storing the much smaller table can give you the benefit of being able to get the additional aggregations that you need for a specialized report, while relying on a larger stored table for the details.

4 Comments
You can use the Distinct Count in Designer. That aggregation is not available in data builder.
Hi Bobbie, How do i create a aggregate column that provides unique count in the data builder.
You would create your calculated column in the data builder and aggregate that column in the data builder also. Then you would be able to create an aggregation of the new column when you access the data in designer.
hi this helped me a lot but the problem i am facing is i need to do aggregation of an aggregation for a calculated variable can you help me out with that
thank you
abhi