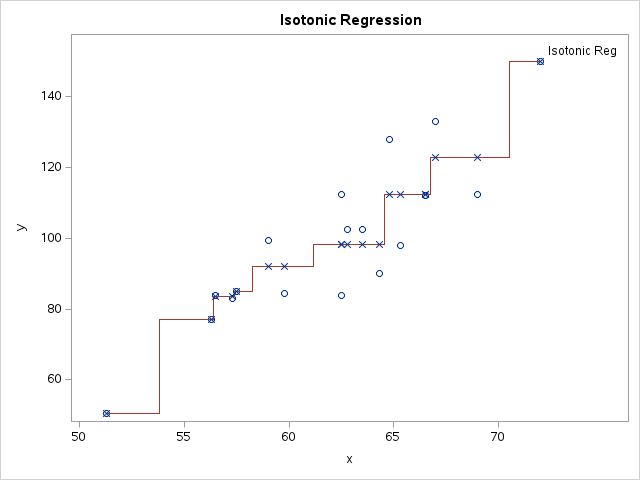
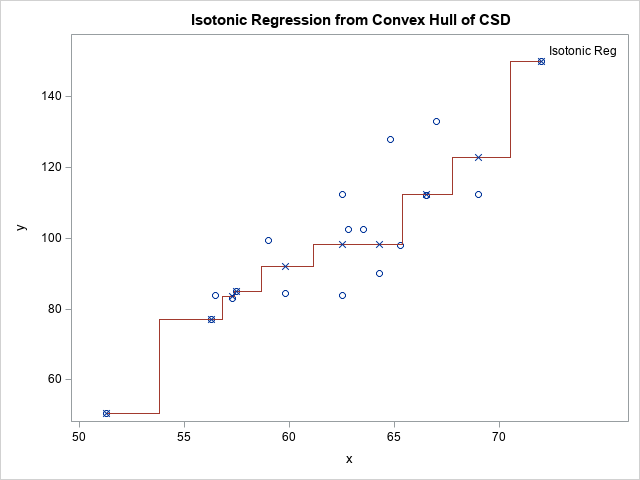
Author

Rick Wicklin
RSS
Distinguished Researcher in Computational Statistics

Rick Wicklin, PhD, is a distinguished researcher in computational statistics at SAS and is a principal developer of SAS/IML software. His areas of expertise include computational statistics, simulation, statistical graphics, and modern methods in statistical data analysis. Rick is author of the books Statistical Programming with SAS/IML Software and Simulating Data with SAS.

Rick Wicklin 0
Generate uniform data in a simplex

It is easy to simulate data that is uniformly distributed in the unit cube for any dimension. However, it is less obvious how to generate data in the unit simplex. The simplex is the set of points (x1,x2,...,xd) such that Σi xi = 1 and 0 ≤ xi ≤ 1

Rick Wicklin 0
Access rows or columns of a matrix by names

Did you know that you can index into SAS/IML matrices by using unique strings that you assign via the MATTRIB statement? The MATTRIB statement associates various attributes to a matrix. Usually, these attributes are only used for printing, but you can also use the ROWNAME= and COLNAME= attributes to subset

Rick Wicklin 0
Visualizing US commute times and congestion

Robert Allison posted a map that shows the average commute times for major US cities, along with the proportion of the commute that is attributed to traffic jams and other congestion. The data are from a CEOs for Cities report (Driven Apart, 2010, p. 45). Robert use SAS/GRAPH software to

Rick Wicklin 0
Construct a magic square of any size

Magic squares are cool. Algorithms that create magic squares are even cooler. You probably remember magic squares from your childhood: they are n x n matrices that contain the numbers 1,2,...,n2 and for which the row sum, column sum, and the sum of both diagonals are the same value. There are many

Rick Wicklin 0
The MOD function and negative values

When I studied math in school, I learned that the expression a (mod n) is always an integer between 0 and q – 1 for integer values of a and q. It's a nice convention, but SAS and many other computer languages allow the result to be negative if a (or q) is

Rick Wicklin 0
How to get data values out of ODS graphics

Many SAS procedures can produce ODS statistical graphics as naturally as they produce tables. Did you know that it is possible to obtain the numbers underlying an ODS statistical graph? This post shows how. Suppose that a SAS procedure creates a graph that displays a curve and that you want

Rick Wicklin 0
Using macro loops for simulation

Last week I wrote an article in which I pointed out that many SAS programmers write a simulation in SAS by writing a macro loop. This approach is extremely inefficient, so I presented a more efficient technique. Not only is the macro loop approach slow, but there are other undesirable

1 38 39 40 41 42 50