I've seen analyses of Fisher's iris data so often that sometimes I feel like I can smell the flowers' scent. However, yesterday I stumbled upon an analysis that I hadn't seen before.
The typical analysis is shown in the documentation for the CANDISC procedure in the SAS/STAT documentation. A (canonical) linear discriminant analysis (LDA) that uses four variables (SepalLength, SepalWidth, PetalLength, and PetalWidth) constructs hyperplanes that can almost separate the species. With an LDA, only three flowers are misclassified: one virginica is misclassified as a versicolor and two versicolor are misclassified as virginica. The following plot is from the SAS/STAT documentation and shows how the first canonical coordinate does a fantastic job of discriminating between the species.
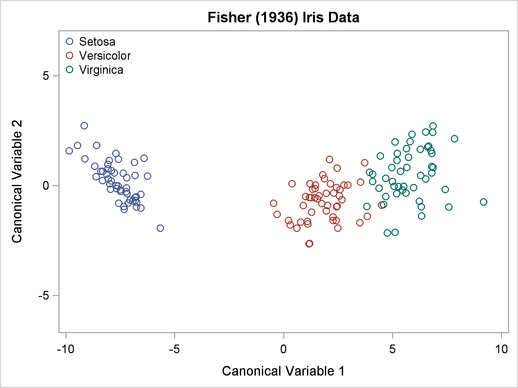
I've always been impressed by this analysis. I consider it a remarkable example of the power of statistics to solve classification problems.
Yesterday I saw a Web page from StatLab Heidelberg at the Institute for Applied Mathematics, Universität Heidelberg. The author points out that the area of the petals and sepals do a much better job of discriminating between the various species. In fact, they point out that you do not even need to use discriminant analysis to obtain a result that is almost as good as LDA!
The following DATA step constructs the area of the sepals and petals, assuming that they are nearly rectangular. You can then plot the new variables:
data iris; set Sashelp.Iris; SepalArea = SepalLength * SepalWidth; PetalArea = PetalLength * PetalWidth; run; proc sgplot data=iris; title "Discriminant Analysis of Iris Data Using Area"; scatter x=SepalArea y=PetalArea / group=Species; refline 150 750 / axis=y; /* add "dividing lines" */ run; |
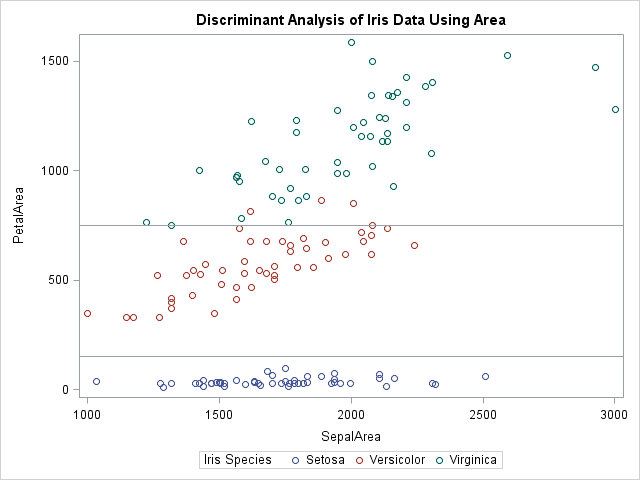
The single variable, PetalArea, does nearly as good a job at classifying the iris species as linear discriminant analysis. In the scatter plot, you can draw horizontal lines that nearly separate the species. The lines that are drawn misclassify only four versicolor as virginica. That's an amazing result for using a single, easily constructed, variable, which has the additional advantage of having physical significance.
I have seen a similar idea used in the discriminant and cluster analysis of the Sashelp.Fish data set. For the fish, it is common to transform weight by a cube-root transformation in order to obtain a variable that is comparable to the heights, widths, and lengths of the fish. However, until now I had never thought about using the area of the iris flower parts.
The iris quadratic transformation is impressive because of its simplicity. I wonder when this was first noticed. Can anyone provide a reference that precedes the 2005 date on the StatLab web page? An internet search located one instance of this transformation in the book Data Clustering and Pattern Recognition, which was printed in Chinese, but I cannot determine who originated the idea.
Update (Nov 2015): Giacomo Patrizi is very insistent that I reference Nieddu and Patrizi (2000), which appeared before the StatLab result; see his comment below.

5 Comments
Hello Rick,
I think the idea that you described is called kernel embedding, where the feature space is enriched to increase the performance of linear classifier. One problem is that in general this could lead to overfitting.
As an aside, the SASHELP.IRIS data contains some errors: three are well-known, and one was "added" in SAS 9.2 but corrected in SAS 9.3. Read about the history here.
The results on Iris and 28 other important well known applications were published in a survey article and the name of the routine was indicated in that paper obviously as 'Products'.
the results reprted was 0.9949 of 150 correctly classified or 1 flower misclassified, which is well known as Fisher/Anderson classified one flower incorrectly.
By the way, the result and other like it consisted of 150 replications of a sample of 10% of the application selected by simple random sampling and no conditions were imposed, as it is precisely discussed in the paper. Results: average 0.9949 best 1.0000 worst 0.9933: often only 1 flower, the culprit, misclassified.
I would be happy to discuss this data and results with you. Contact me, if you like at Giacomo.Patrizi@uniroma1.it.
Yours
Giacomo Patrizi
Thanks for the reference. Professor's Patriz's "products" method (Nieddu and Patrizi, 2000) augments the feature space by adding the p(p-1)/2 pairwise products of the p variables.
Yes, in my algorithm "products", the addition if 1 feature per instance allows you to classify correctly all the instances but one, which is classified incorrectly to start with. Instead 4 instances will be incorrectly classified (or so) by your simplicity heuristic.
Note that the my feature space augmentation consists of 1 additional multiplication per instance, while your method requires 2 multiplications per instance.
What is the point to pull wool over one's eyes? Is the objective of classification to do the least work or to obtain the best results?
The british would say that you are throwing the baby with the bath water.
All the best
Giacomo Patrizi