All Posts


Throughout life we are bound to grieve many things but often may not realize when we are grieving. I am not referring to the grief felt after the death of a loved one. This post is not meant to equate these losses to the experience of the death of a
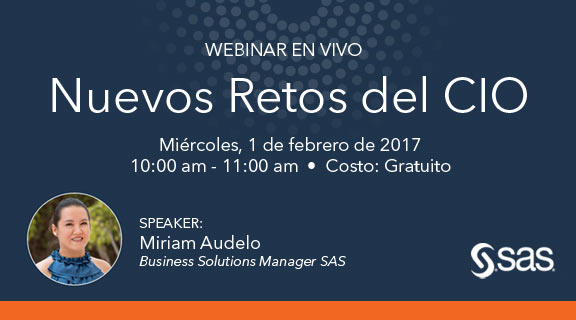

Actualmente es muy común escuchar conversaciones relacionadas a la necesidad de transformar el negocio para competir en el nuevo entorno digital, incluso algunas organizaciones están diseñando sus planes para llevar a cabo esta transformación. Los principales cambios que se están planteando en las organizaciones están relacionados con la necesidad de


I've been working on a pilot project recently with a client to test out some new NoSQL database frameworks (graph databases in particular). Our goal is to see how a different storage model, representation and presentation can enhance the usability and ease of integration for master data indexes and entity

SAS® Viya™ 3.1 represents the third generation of high performance computing from SAS. Our journey started a long time ago and, along the way, we have introduced a number of high performance technologies into the SAS software platform: In-Database processing where SAS data quality and analytical processing occur within the
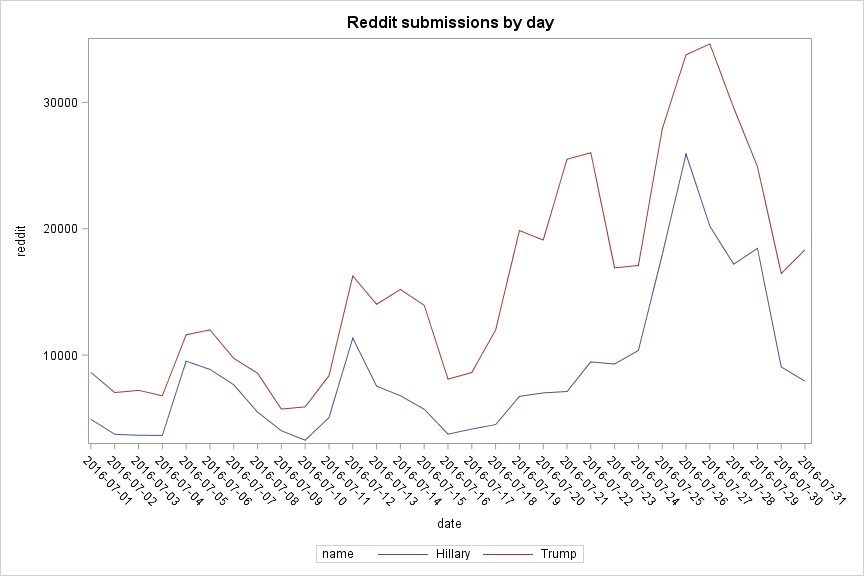

Recently a colleague told me Google had published new, interesting data sets at BigQuery. I found a lot of Reddit data as well, so I quickly tried running BigQuery with these text data to see what I could produce. After getting some pretty interesting results, I wanted to see if


Tell me if you’ve heard this before: Your company hired (or re-titled) a talented data scientist and they have great skills and no data. Or they're marginalized by IT because they're misunderstood. They're offered “cleansed” data that will fit into the hardware provisioned. What they want is “all” relevant data


Are you one of those people who get easily bored at amusement parks? Would you like something to do while your friends/family are waiting in line for a ride? Perhaps I have an alternate idea, to keep you busy - survey markers! When surveyors are measuring and marking areas for


We’ve become a lower carb household in the past few years due to family health history and genetics that strongly encourage it. As a result, our decades-old breakfast of eating cereal with milk went out with the trash leaving the challenge of finding low carb, nutrient-dense options.
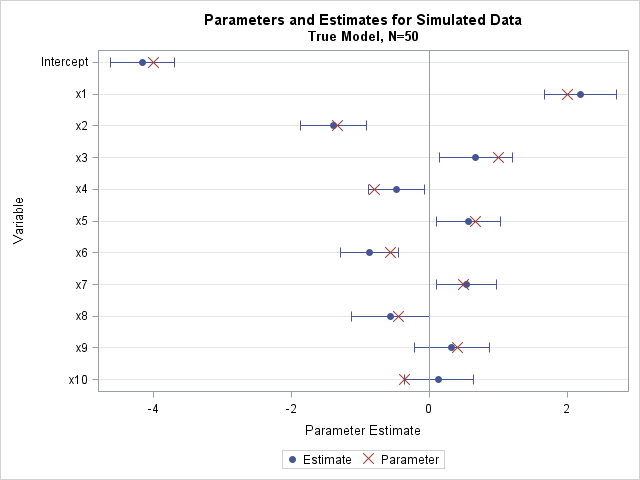

This article shows how to simulate a data set in SAS that satisfies a least squares regression model for continuous variables. When you simulate to create "synthetic" (or "fake") data, you (the programmer) control the true parameter values, the form of the model, the sample size, and magnitude of the


Editor's note (10/25/17): You can practice what you learned in class with 15 hours of Free virtual lab time when you attend the in-person or Live Web Applied Analytics Using SAS Enterprise Miner class. Register now. Are you interested in taking an advanced course on the machine learning topic of Neural Networks? Does text


Historically, tax havens have been a key tool for tax evaders to store and hide unreported and untaxed money. I would agree with most observers that the Panama papers (11.5 million leaked documents that detail financial information for more than 214,488 offshore entities) are just the tip of the tax


In a previous blog, Random Sampling: What's Efficient?, I discussed the efficiency of various techniques for selecting a simple random sample from a large SAS dataset. PROC SURVEYSELECT easily does the job: proc surveyselect data=large out=sample method=srs /* simple random sample */ rate=.01; /* 1% sample rate */ run; Note:


We are a few months away from SAS Global Forum in Orlando. You might think that the conference kicks off Sunday night at opening session, but there are plenty of weekend activities before then and I’d like to highlight one of them: SAS certification exam sessions. Isn’t now a great
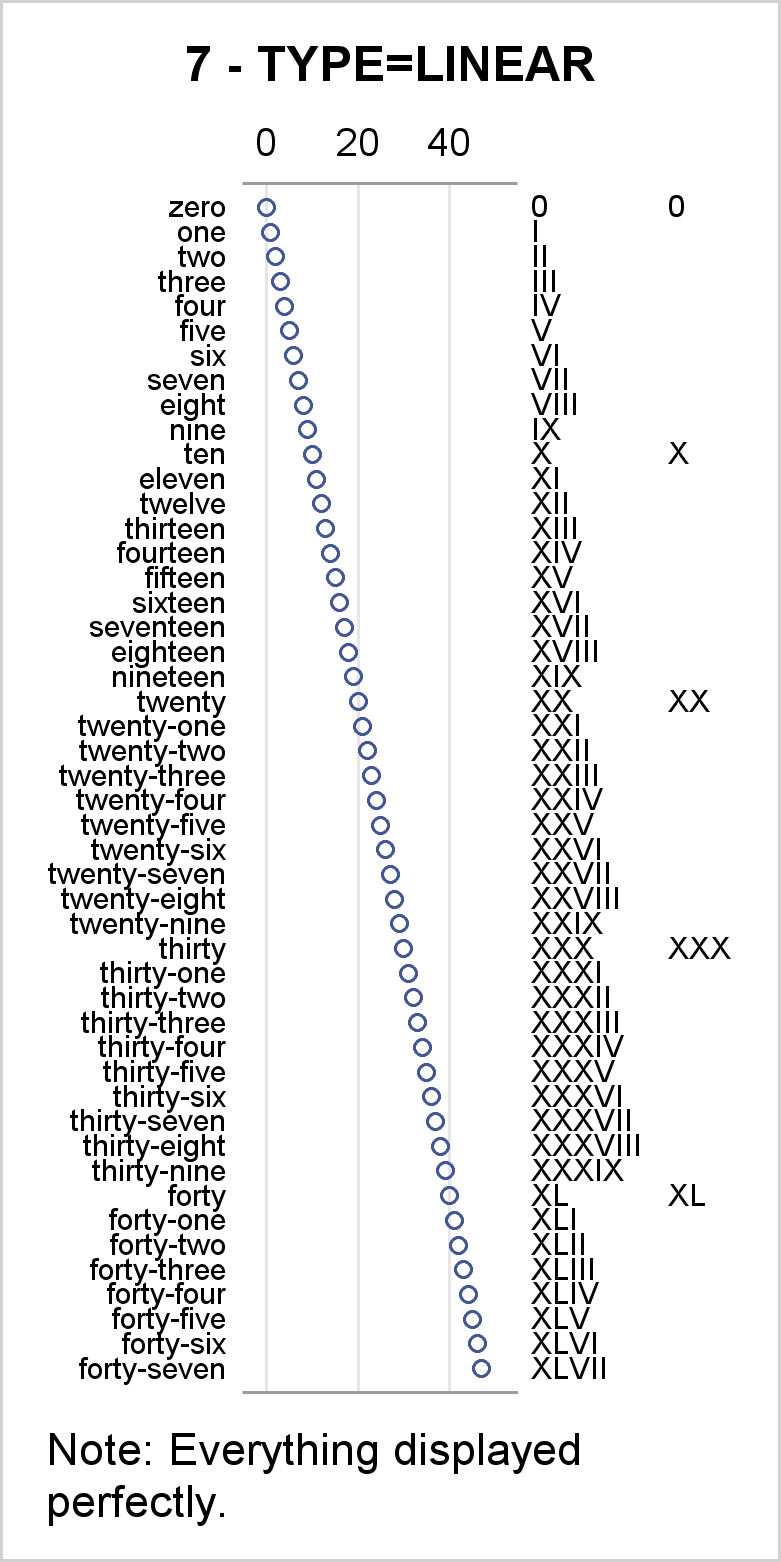

I review some fundamental principles of creating axis tables along with graphs that have TYPE=LINEAR or TYPE=DISCRETE axes.
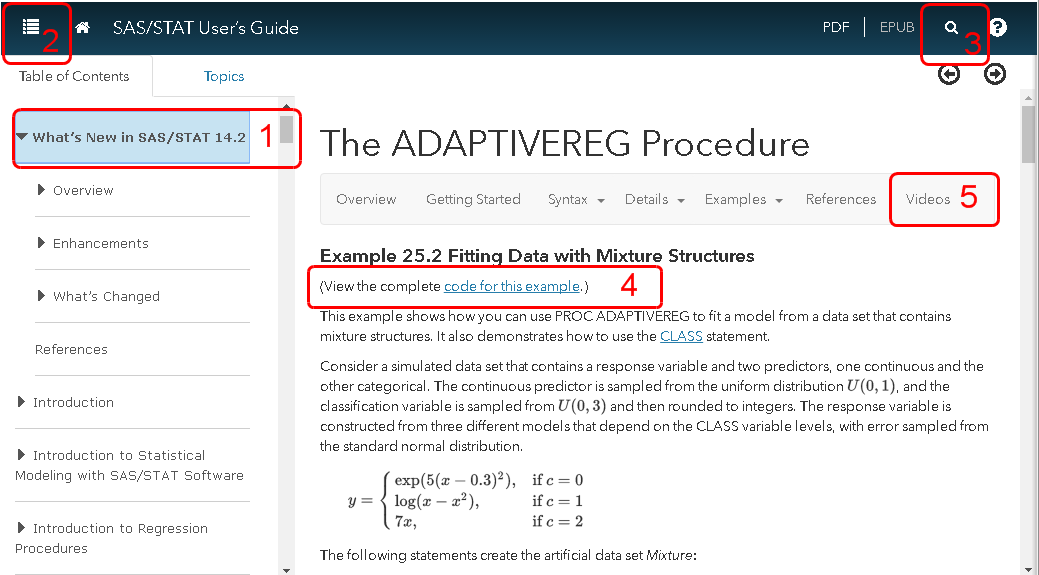
The SAS analytical documentation has a new look. Beginning with the 14.2 release of the SAS analytical products (which shipped with SAS 9.4m4 in November 2016), the HTML version of the online documentation has moved to a new framework called the Help Center. The URL for the online documentation is