All Posts


.@philsimon chimes in with trust- and privacy-related recommendations


Have you ever wondered why your friend lost weight on a specific diet and you lost nothing, even though you did exactly what he or she did, or why your spouse’s cholesterol is better than yours even though you eat the same foods? It’s because we are all different and
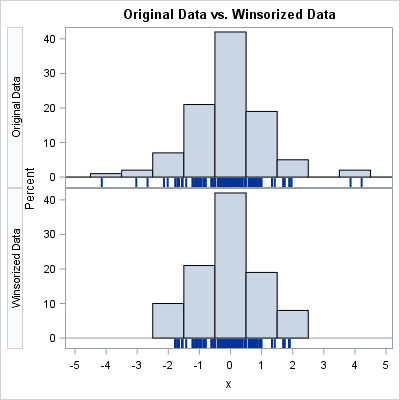

On discussion forums, I often see questions that ask how to Winsorize variables in SAS. For example, here are some typical questions from the SAS Support Community: I want an efficient way of replacing (upper) extreme values with (95th) percentile. I have a data set with around 600 variables and
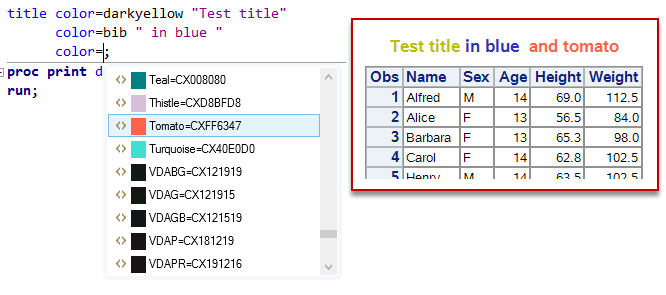

Colors are the subject of many romantic poems and songs, but there isn't much romance to be found in their hexadecimal values. With apologies to Van Morrison: ...Skipping and a jumping In the misty morning fog with Our hearts a thumpin' and you My cx662F14 eyed girl When it comes
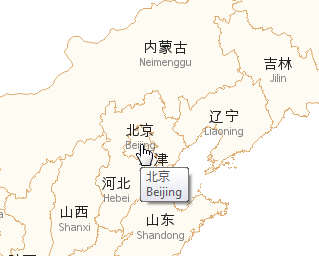

Doing business in a global economy, have you ever found yourself wanting to show Chinese (or Korean, or Japanese) labels on a map? If so, then this blog is for you! Before we get started, here is a photo of some Chinese characters to get you into the mood. This


The last time I wrote a blog about teen dating, I shared that my colleague, Lisa Allred, and I were learning new terms from the teens in our lives. One was “ship”. Of course, the funny part was that although Lisa got the concept correct, she mis-remembered the actual term.


On any inauguration day in our country’s history people probably found themselves in one of three categories: happy & hopeful, disappointed & apprehensive, or apathetic & checked-out. Change is difficult, whether you perceive it as positive or negative. This blog is not to share which category I fall into but


The financial sector has always been subjected to regulatory compliance laws and directives. Consumers, lawmakers and politicians would expect no less. But it's fair to say that the financial sector has witnessed a "hockey stick" trend regarding new regulations in recent years.
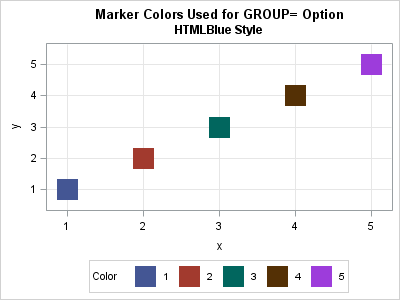
Suppose you create a scatter plot in SAS with PROC SGPLOT. What color does PROC SGPLOT use for the markers? If you specify the GROUP= option so that markers are colored by a grouping variable, what colors are used to represent the various groups? The following scatter plot shows the
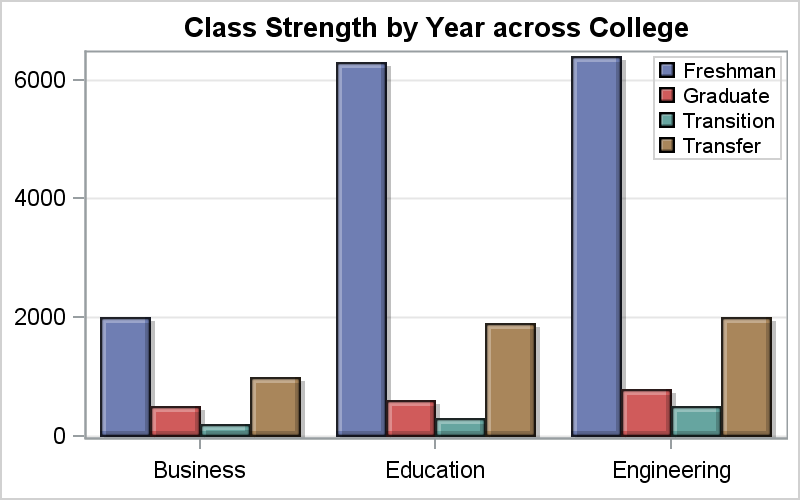

Back in 2013, I wrote a paper for the SAS Global Forum, reviewing the attributes that go towards making a good graph. In this paper, I covered many recommendations from industry thought leaders that can help enhance the effectiveness of graphs to deliver the intended information. One of the aspects that


Last night I dropped a check into my son’s school’s American Heart Association Fund Raiser and this morning we kicked off #NationalWearRedDay at the RFC with our annual Wear RED for Heart Health Breakfast Run. What’s the deal with all heart health awareness this month? Heart Disease Not only is it


El próximo domingo, si los pronósticos de los expertos se cumplen, disfrutaremos de un juego espectacular: un duelo sin cuartel, entre Halcones de Atlanta y Patriotas de Nueva Inglaterra, para conseguir el mítico trofeo Vince Lombardi. En la National Football League (NFL), los equipos –y sus estructuras de negocio– ya
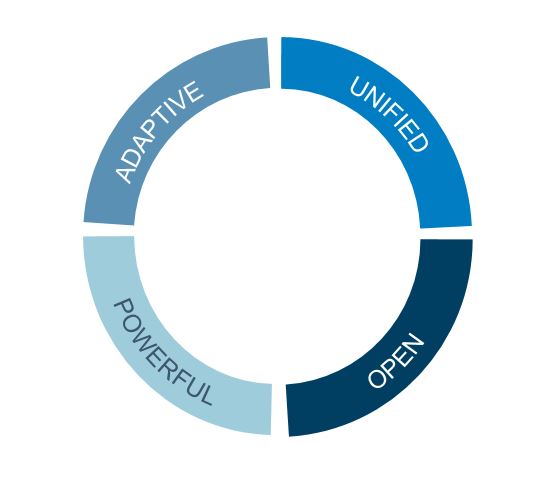

Having addressed the adaptability and power of an analytics environment in my last two posts, I thought I'd close out this mini-series of blogs by providing the business and technology implications of three attributes that need to define any truly open and unified analytics environment: Cohesion Business: The platform enables


I will begin with a short story. Like many employers, McDougall Scientific, my employer, requires its employees to review, with their co-workers and managers, what they learned at a conference or course. They are also asked to suggest applications of their learnings so that McDougall might realize value from the


It was just a few years ago that the idea of an Internet of Things (IoT) seemed far off, something out of a science-fiction movie. After all, why would a vehicle need to talk to the road? Why would our utility meters need to talk to the central office? The