All Posts


It was just a few years ago that the idea of an Internet of Things (IoT) seemed far off, something out of a science-fiction movie. After all, why would a vehicle need to talk to the road? Why would our utility meters need to talk to the central office? The


Strengthens arms, shoulders, back, core and quadriceps Four-Limbed Staff Pose (Sanskrit: Chaturanga Dandasana) Start on hands and knees and then move into Plank. Wrists are under shoulders and you’re engaging quadriceps and pressing through heels as if you’re stepping on the floor. Core is engaged and drawing in towards spine.


.@philsimon says that, once again, there's quite a bit to learn from Amazon.


Definir las prioridades de negocio y gestionarlas con analítica conduce a un camino exitoso. Ante la transformación digital que viven las organizaciones de las diversas industrias del mercado, el CIO se convierte en ese agente de cambio que habilita el camino hacia la innovación y éxito de la organización. Cuestionarse


Looking for ways to add some variability to your routine? Try these row options. You can choose one or all as you focus on your back while keeping your core engaged. The row incorporates almost every muscle involved in moving your shoulder and your elbow. It also relies on muscles of
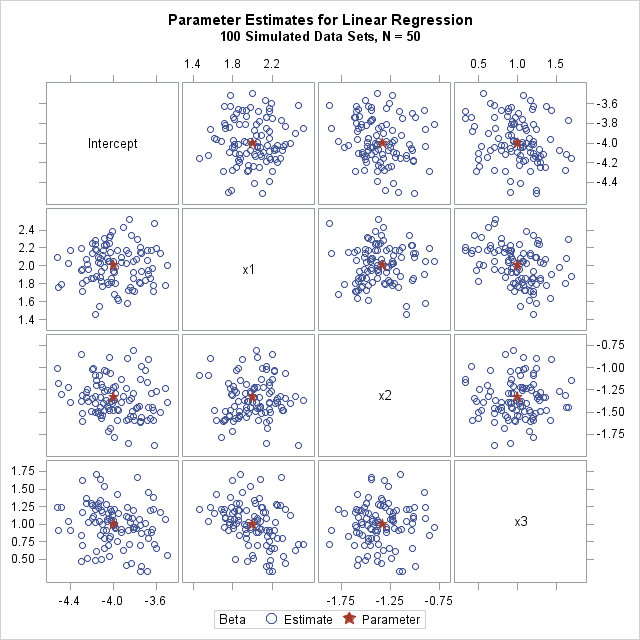

In a previous article, I showed how to simulate data for a linear regression model with an arbitrary number of continuous explanatory variables. To keep the discussion simple, I simulated a single sample with N observations and p variables. However, to use Monte Carlo methods to approximate the sampling distribution
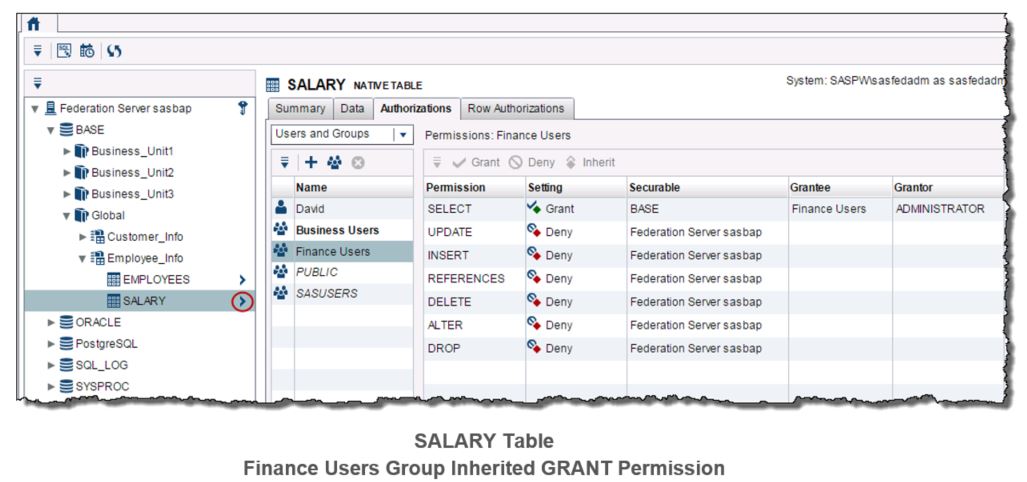

SAS® Federation Server provides a central, virtual environment for administering and securing access to your data. It also allows you to combine data from multiple sources without moving or copying the data. SAS Federation Server Manager, a web-based application, is used to administer SAS Federation Server(s). Data privacy is a


A diario, las empresas compiten aguerridamente entre sí para atraer nuevos clientes, conservar los que ya tienen y asegurar su lealtad por mucho tiempo. Sin embargo, no es una tarea fácil, especialmente cuando los consumidores están más conectados e informados que nunca y su entorno es cada vez más competitivo.


I usually create very technical maps, to display data spatially - and they usually have a certain look. They're clear, crisp, and to the point. I typically only use color to represent the data, and I choose a font that is simple and easy to read (such as arial). But


Did you know that January is Human Trafficking Awareness Month in the United States? If not, you may not know that researchers estimate that human trafficking is a global industry with revenues from $51 to $99 billion annually, up from $32 billion just a few years ago. In this case,


You have all seen, or perhaps even created, some really bad graphics: Cluttered, confusing, too small, incomprehensible. Or worse, the author may have committed one of the three unforgivable sins of data visualization by deceptively distorting a map, truncating the axis so as to misrepresent the data, or used double
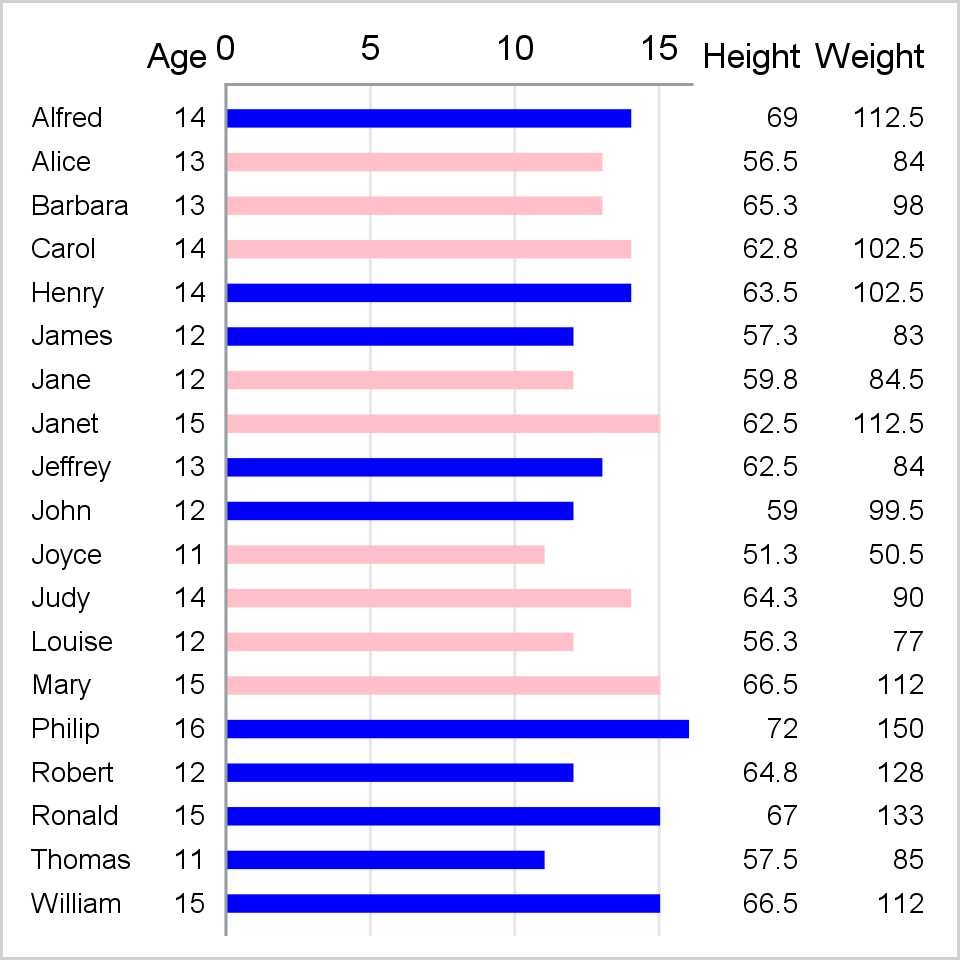

PROC SGPLOT writes a graph template and uses it to create a graph. You can edit the template and then create a modified graph.


Recently, SAS shipped the fourth maintenance of SAS 9.4. Building on this foundation, SAS Studio reached a new milestone, its 3.6 release. All editions have been upgraded, including Personal, Basic and Enterprise. In this blog post, I want to highlight the new features that have been introduced. In subsequent posts
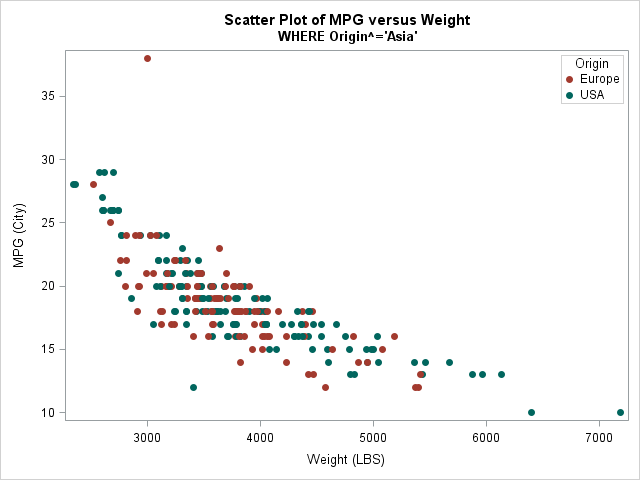
If you are a SAS programmer and use the GROUP= option in PROC SGPLOT, you might have encountered a thorny issue: if you use a WHERE clause to omit certain observations, then the marker colors for groups might change from one plot to another. This happens because the marker colors


I’ve had several meetings lately on data management, and especially integration, where the ability to explore alternatives has been critical. And the findings from our internet of things (IoT) early adopters survey confirms that the ecosystem nature of data sources in IoT deployments means we need to expand the traditional