All Posts


Phil Simon chimes in on the tendency to rely upon these tools too much.

SAS will be represented by more than 20 attendees at the INFORMS Annual Meeting at the George R. Brown Convention Center (GBCC) in Houston, Texas. Officially the conference runs from Sunday, Oct. 22 through Wednesday, Oct. 25, but our activities in Houston start even earlier. Technology Workshops on Saturday, October
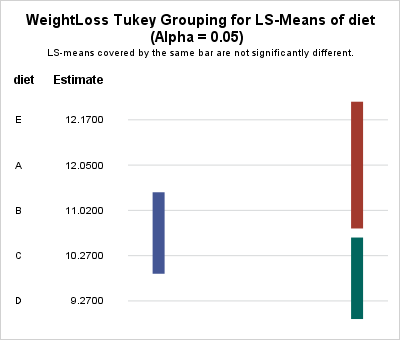

Last week Warren Kuhfeld wrote about a graph called the "lines plot" that is produced by SAS/STAT procedures in SAS 9.4M5. (Notice that the "lines plot" has an 's'; it is not a line plot!) The lines plot is produced as part of an analysis that performs multiple comparisons of
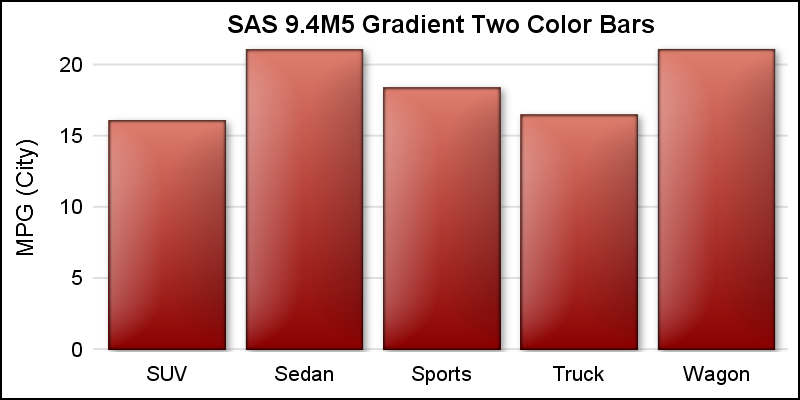

ODS Graphics procedures primarily strive towards the following goal: "Make simple graphs easy and complex graphs possible". SGPLOT procedure allows you create simple graphs with a single plot statement, and create complex graphs by layering together or combining multiple plot statements. Generally, the appearance follows the guidelines set by industry
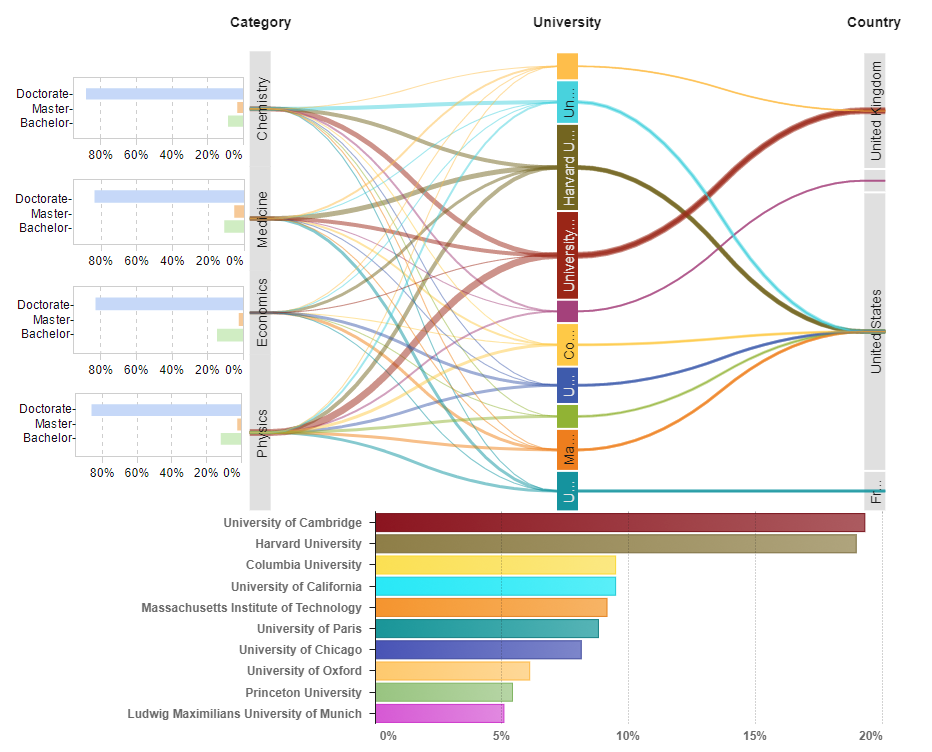

Every year in early October, the eyes of the world turn to Sweden and Norway, where the Nobel Prize winners are announced to the world. The Nobel Prize is considered the world's most prestigious award. Since 1901, the Prize has been presented to individuals and organizations that have made significant

In this education analytics series of blog posts, we have been on a journey to learn how education customers are turning their data into insights to be a more data-informed and analytical organization. So far on our journey, we learned how education customers are using SAS, the positive impact that SAS


En las sesiones de “Content Marketing World” que se llevaron a cabo en Cleveland, Robert Rose, Senior Advisor en The Content Advisory, dijo que el futuro de “Los Marketeros” está en crear nuevas estrategias para la creación de ideas realmente interesantes. El marketing es una labor que constantemente tiene que


모바일 퍼스트(Mobile First)를 넘어선 모바일 온리(Mobile only) 시대입니다. 스마트폰이나 태블릿 PC로 언제 어디서나 온라인 쇼핑몰, 모바일 앱, 소셜 미디어 등 다양한 플랫폼을 통해 정보를 검색, 공유하고 제품을 구매할 수 있죠. 이처럼 기업이 고객과 만나는 접점은 그 어느 때보다 다양해지고 있으며, 그만큼 고객의 요구와 기대의 변화에 귀를 기울이고 재빠르게 대응해야 할 필요성이
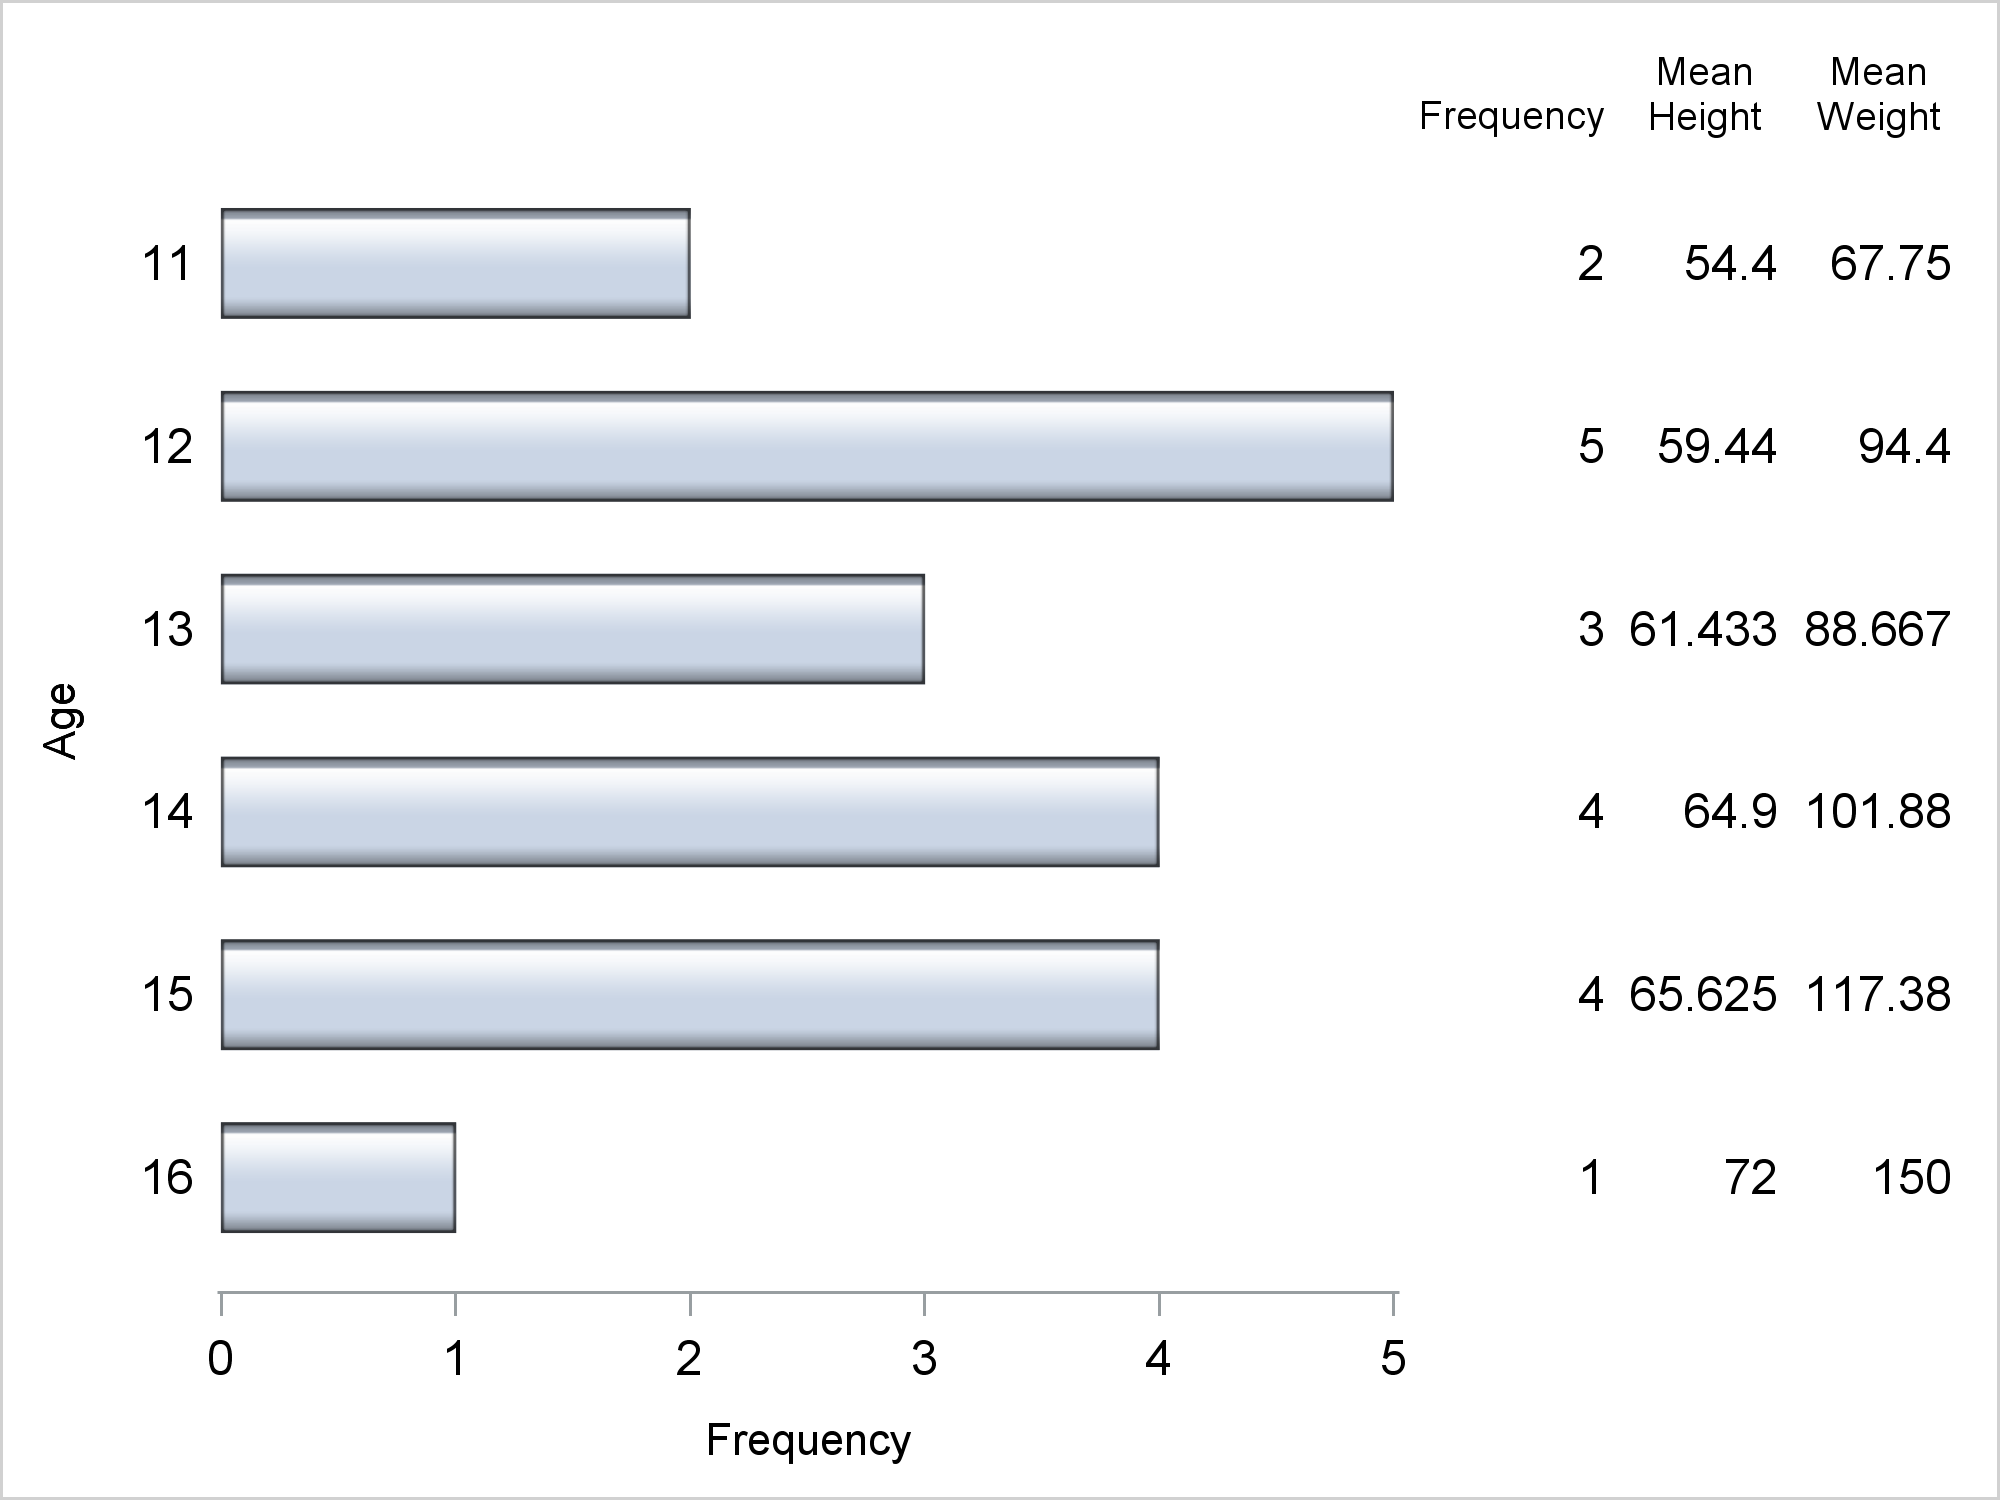

Axis tables can use the SUM= option to summarize data and display means, medians, sums, and percentages. They can instead be used to display data, text, and statistics without any summarization.


No es un golpe de suerte o una tendencia anómala la emitida por IDC que sustenta que entre 2015 y 2019 la inversión en tecnologías de análisis de datos crecerá un 50%, alcanzando en ese último año los US$187.000 millones. Tampoco lo es que para este año se estime que el


I’ve been making note of recent interactions and observations with different companies that I’ve done business with lately. My goal is to share with you real ways in which excellent customer experiences are shaped. Observation #1: Witty conversations rule As I write this, I’m sitting at a Panera Bread restaurant


Jim Harris says more reusable data quality processes mean less reliance on IT and higher productivity across the board.


I recently took a trip to Scotland, to attend the Highland Games! (ok - that statement might be a tiny bit misleading) It was a very cool and interesting event, and I wondered where and when other such events might be happening. What better way to analyze this kind of


According to a study published in May 2017, people who don’t get enough sleep eat, on average, 385 MORE calories than usual with significantly less protein and more fat. They also experience a heightened motivation to seek food for reward (i.e. that donut and sweet coffee drink in the morning look
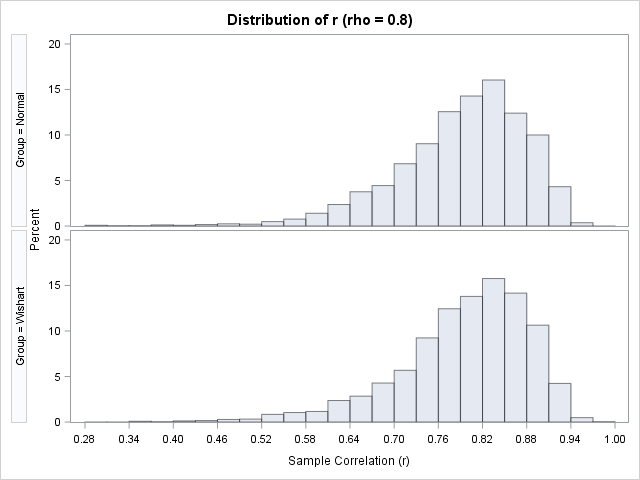
The article "Fisher's transformation of the correlation coefficient" featured a Monte Carlo simulation that generated sample correlations from bivariate normal data. The simulation used three steps: Simulate B samples of size N from a bivariate normal distribution with correlation ρ. Use PROC CORR to compute the sample correlation matrix for