I recently paddled in a boat race, and was wondering how I did compared to all the other paddlers. And being a Graph Guy, I decided I should find a cool way to graph the data ...
Here's some background information ... There's a great organization called Bridge II Sports that has a mission to "educate, develop and implement opportunities for youth and adults with physical disabilities to play individual, team and recreational sports." They recently worked with Wake County, MetLife, and other partners to get a special dock built at Lake Crabtree (here in Cary) that handicapped paddlers can use to launch their boats, and get in/out of them ... totally unassisted! This is perhaps the most accessible dock in the country. They also have an annual race at this lake, to raise money and awareness.
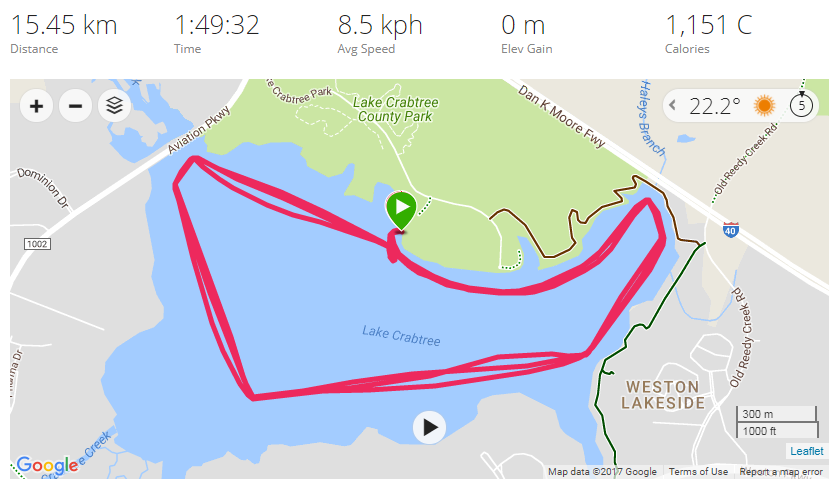
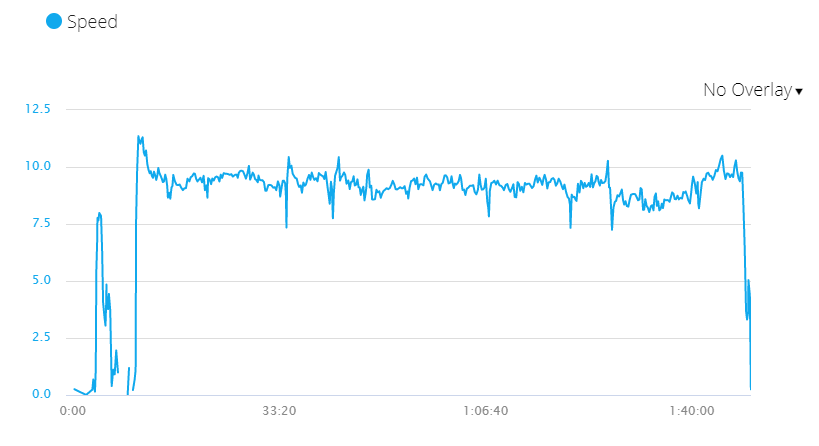
The race had two options - the "3 mile challenge" or the "10 mile marathon" (one lap, or three laps around the lake). I opted for the marathon. I took along my Garmin 305 sports GPS, and it captured data to produce a nice map & graph:
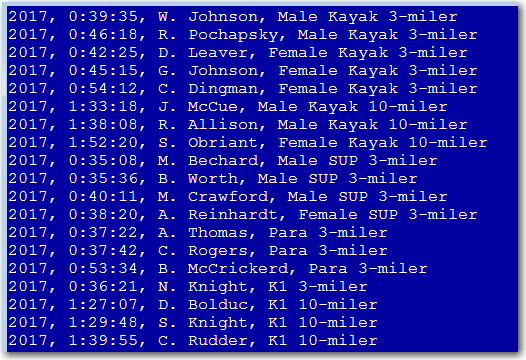
The Garmin graphs were fine for viewing data about me ... but I wanted to know how I did in relation to the other paddlers (and I didn't have GPS data for them, of course). But what I did have was a page of the race results! Here's a screen-capture of a portion of the results page:
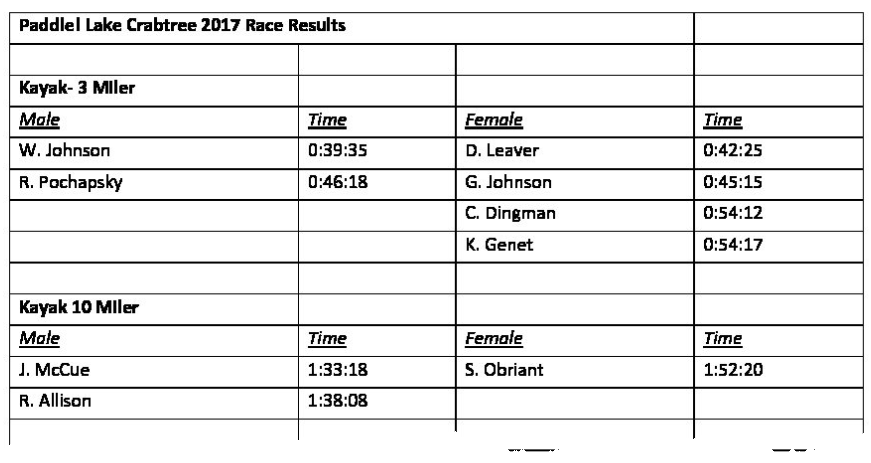
The results were in the form of a jpg image, so I re-typed them (by hand) into a text file, and imported the text file into a SAS dataset.
I was then able to make some cool/custom graphs of the race times. Below are two separate graphs for the 3-mile and 10-mile paddlers:


The graphs were interesting, but since there were so few 3-lap (10-mile) paddlers, I didn't really have many people to compare myself to. I wondered if I could also compare my time to the 1-lap racers' times? Since only the final times were recorded, I deduced that the best number I could come up with for comparisons was to divide my 3-lap time by 3, and get my "average 1-lap time". Granted, if I was only racing 1 lap I would have done it a little faster ... but as they say, this number will be "close enough for government work". I calculated this number using the following code:
if index(category,'10-miler')^=0 then three_mile_time=time/3;
else three_mile_time=time;
And here is the final graph - I'm pretty happy with it, and pretty happy with my time. You can click the image below to see the interactive version of the graph, that has HTML mouse-over text showing what kind of boat each person was paddling. Looks like I came in 4th overall (and the #1 and #2 paddlers were in very fast Olympic-style K1 boats).
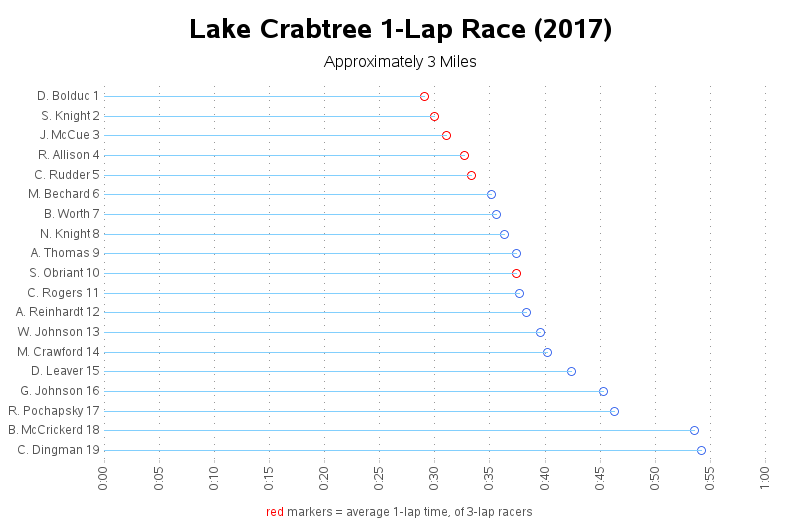
And if you're a SAS coder, and curious as to what 'tricks' I used to customize the graph ...
- The values plotted along the y-axis are actually the numeric rank, to get the markers in the desired order.
- I got the numeric rank values to plot as the desired text (name & rank) by creating a user-defined-format.
- The line going from the plot marker to the y-axis is annotated.
- I used the z-variable (plot y*x=z) to control the color of the markers.
- And I used a 'footnote' statement to explain the coloring of the markers (rather than using a traditional legend).
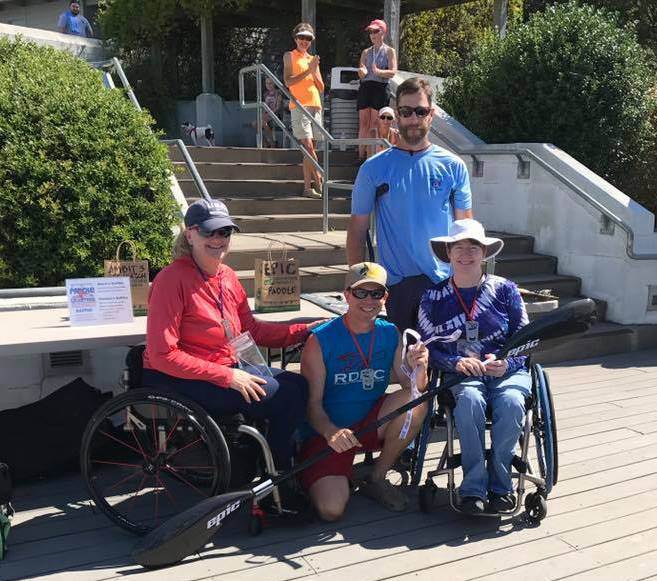
Data analysis & statistics are very important to professional athletes, and can help them win races. And although they didn't help me win first place in this race ... they did help me win something that day. Several sponsors donated prizes to be raffled off (with the proceeds going to the charity). One of the prizes was a really nice Epic Mid Wing carbon kayak paddle - the perfect paddle to go with my Epic V10-sport surfski. Since the money was going to a good cause, how could I not increase my chances of winning by buying, umm ... 'several' extra raffle tickets. And here's a picture of me with the paddle I won! :)