All Posts


Do you struggle to consume the recommended 2 servings of seafood per week? Well, you’re not alone. Research shows that 80-90% of Americans do not eat enough seafood each week. Some people simply don’t like seafood. Others can’t stand that fishy smell (or even the thought of it!). A lot


Is it getting harder and harder to find empty Excel spreadsheets cells, as you run out of columns and rows? Do your spreadsheet cell labels have more letters than the license plate on your car? Do you find yourself waking up in the middle of the night in cold
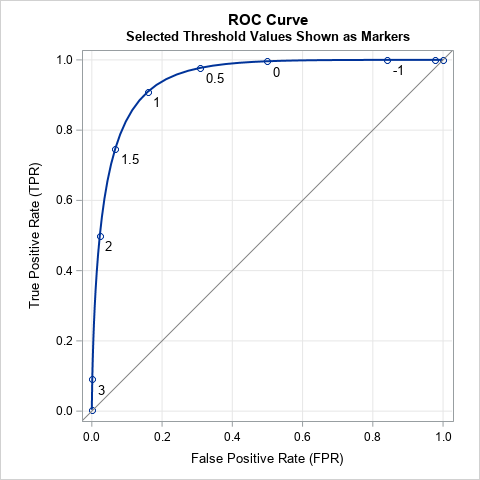

The ROC curve is a graphical method that summarizes how well a binary classifier can discriminate between two populations, often called the "negative" population (individuals who do not have a disease or characteristic) and the "positive" population (individuals who do have it). As shown in a previous article, there is


Editor's note: Given the global disruption of COVID-19, we’ve made the very difficult decision to cancel the 2020 Summer Teacher Institute. This is an experience we look forward to every year; however, like you, we feel hesitant to plan for in-person events given the evolving unpredictability surrounding this crisis. As


Last summer, I joined a growing trend: I took an online course on machine learning algorithms run by Stanford University.


In my office is a coaster with this quote from Kathleen Norris: “Anything, everything, little or big, becomes an adventure when the right person shares it.” The right person could be anyone, but for the sake of our annual Work/Life relationship series, I'm thinking about romantic partners. In the context


Los avances recientes de la analítica, en conjunto con la Inteligencia Artificial y las soluciones de la Nube están logrando consolidar nuevas oportunidades dentro del sector retail, las cuales facilitan las operaciones de las empresas ayudándoles a ser más eficientes en la optimización de inventario, automatización de pronósticos, análisis de

Ridgeline plots are useful for visualizing changes in the shapes of distribution over multiple groups or time periods. Let us look at an example of how we can create this plot using the SGPLOT procedure that is part of the ODS Graphics Procedures. For this example, we will plot the
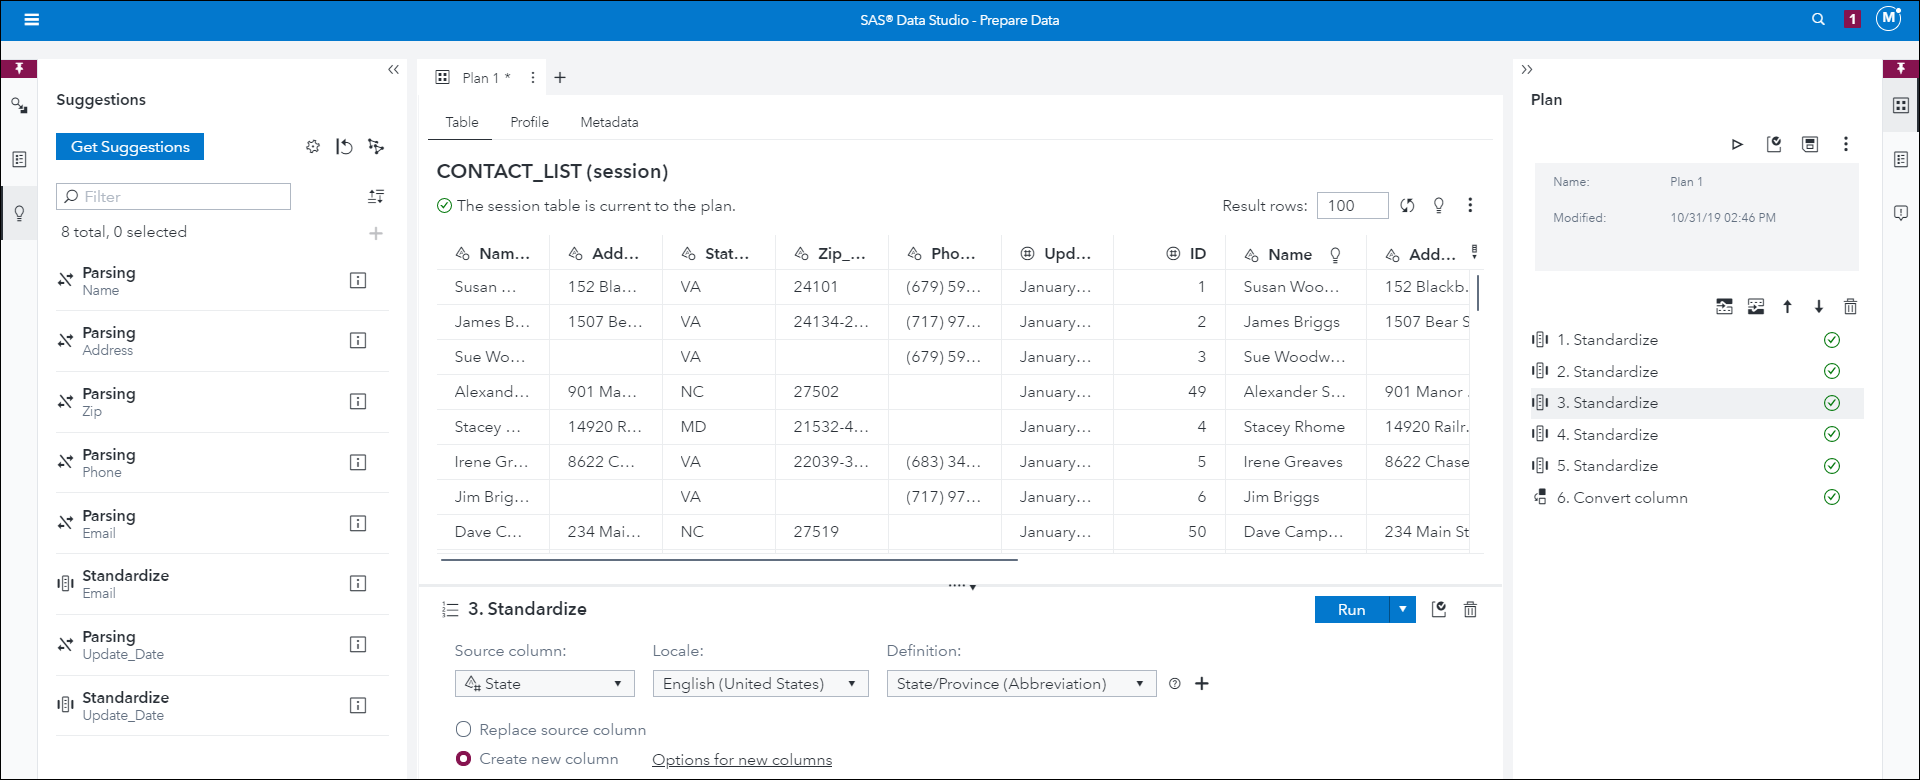

SAS Technical Training Consultant Mary Kathryn Queen introduces you to SAS Data Studio's Suggestions feature.


Wer sind wir? Üblicherweise stellen sich nur menschliche Philosophen diese Frage. Doch mit Einzug von Künstlicher Intelligenz ist auch Unternehmensleitern angeraten, solches zu fragen. Nicht, dass sich welche für IT-Dienstleister halten, doch in Wahrheit Personaldienstleister sind. Was ja nicht schlimm wäre, solange sich das Produkt verkauft. Doch mit zunehmender Globalisierung
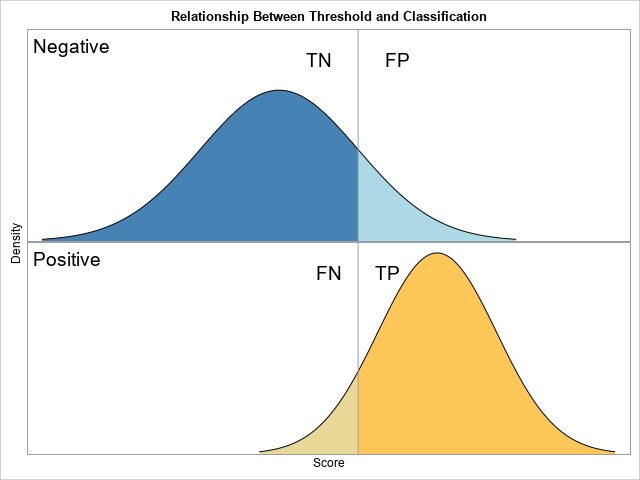
The purpose of this article is to show how to use SAS to create a graph that illustrates a basic idea in a binary classification analysis, such as discriminant analysis and logistic regression. The graph, shown at right, shows two populations. Subjects in the "negative" population do not have some


¿Qué pasa cuando algo tan poderoso como IA libera el potencial del talento humano? Click To Tweet Este paradigma implica cambios en la cultura de las organizaciones a través de la combinación de Innovación, Talento y Tecnología. Pero la transformación digital va más allá de generar utilidades y reducir costos,

SAS' Kris Stobbe shows how you can predict survival rates of Titanic passengers with a combination of both Python and CAS using SWAT, then see how the models performed.


There’s something about the calendar rolling over to a New Year that makes most of us want to set new goals or start fresh. I’m no different. This year’s goals regarding my own physical health included a commitment to having 8 – 10 servings of vegetables per day and more


Um dos principais focos do SAS é entregar, aos clientes, soluções comprovadas e inovadoras que garantam a melhoria do seu desempenho e os ajudem a diferenciar-se dentro da sua área e mercado de atuação. Ajudá-los a tirar o máximo proveito de cada ferramenta faz também parte da missão do SAS,