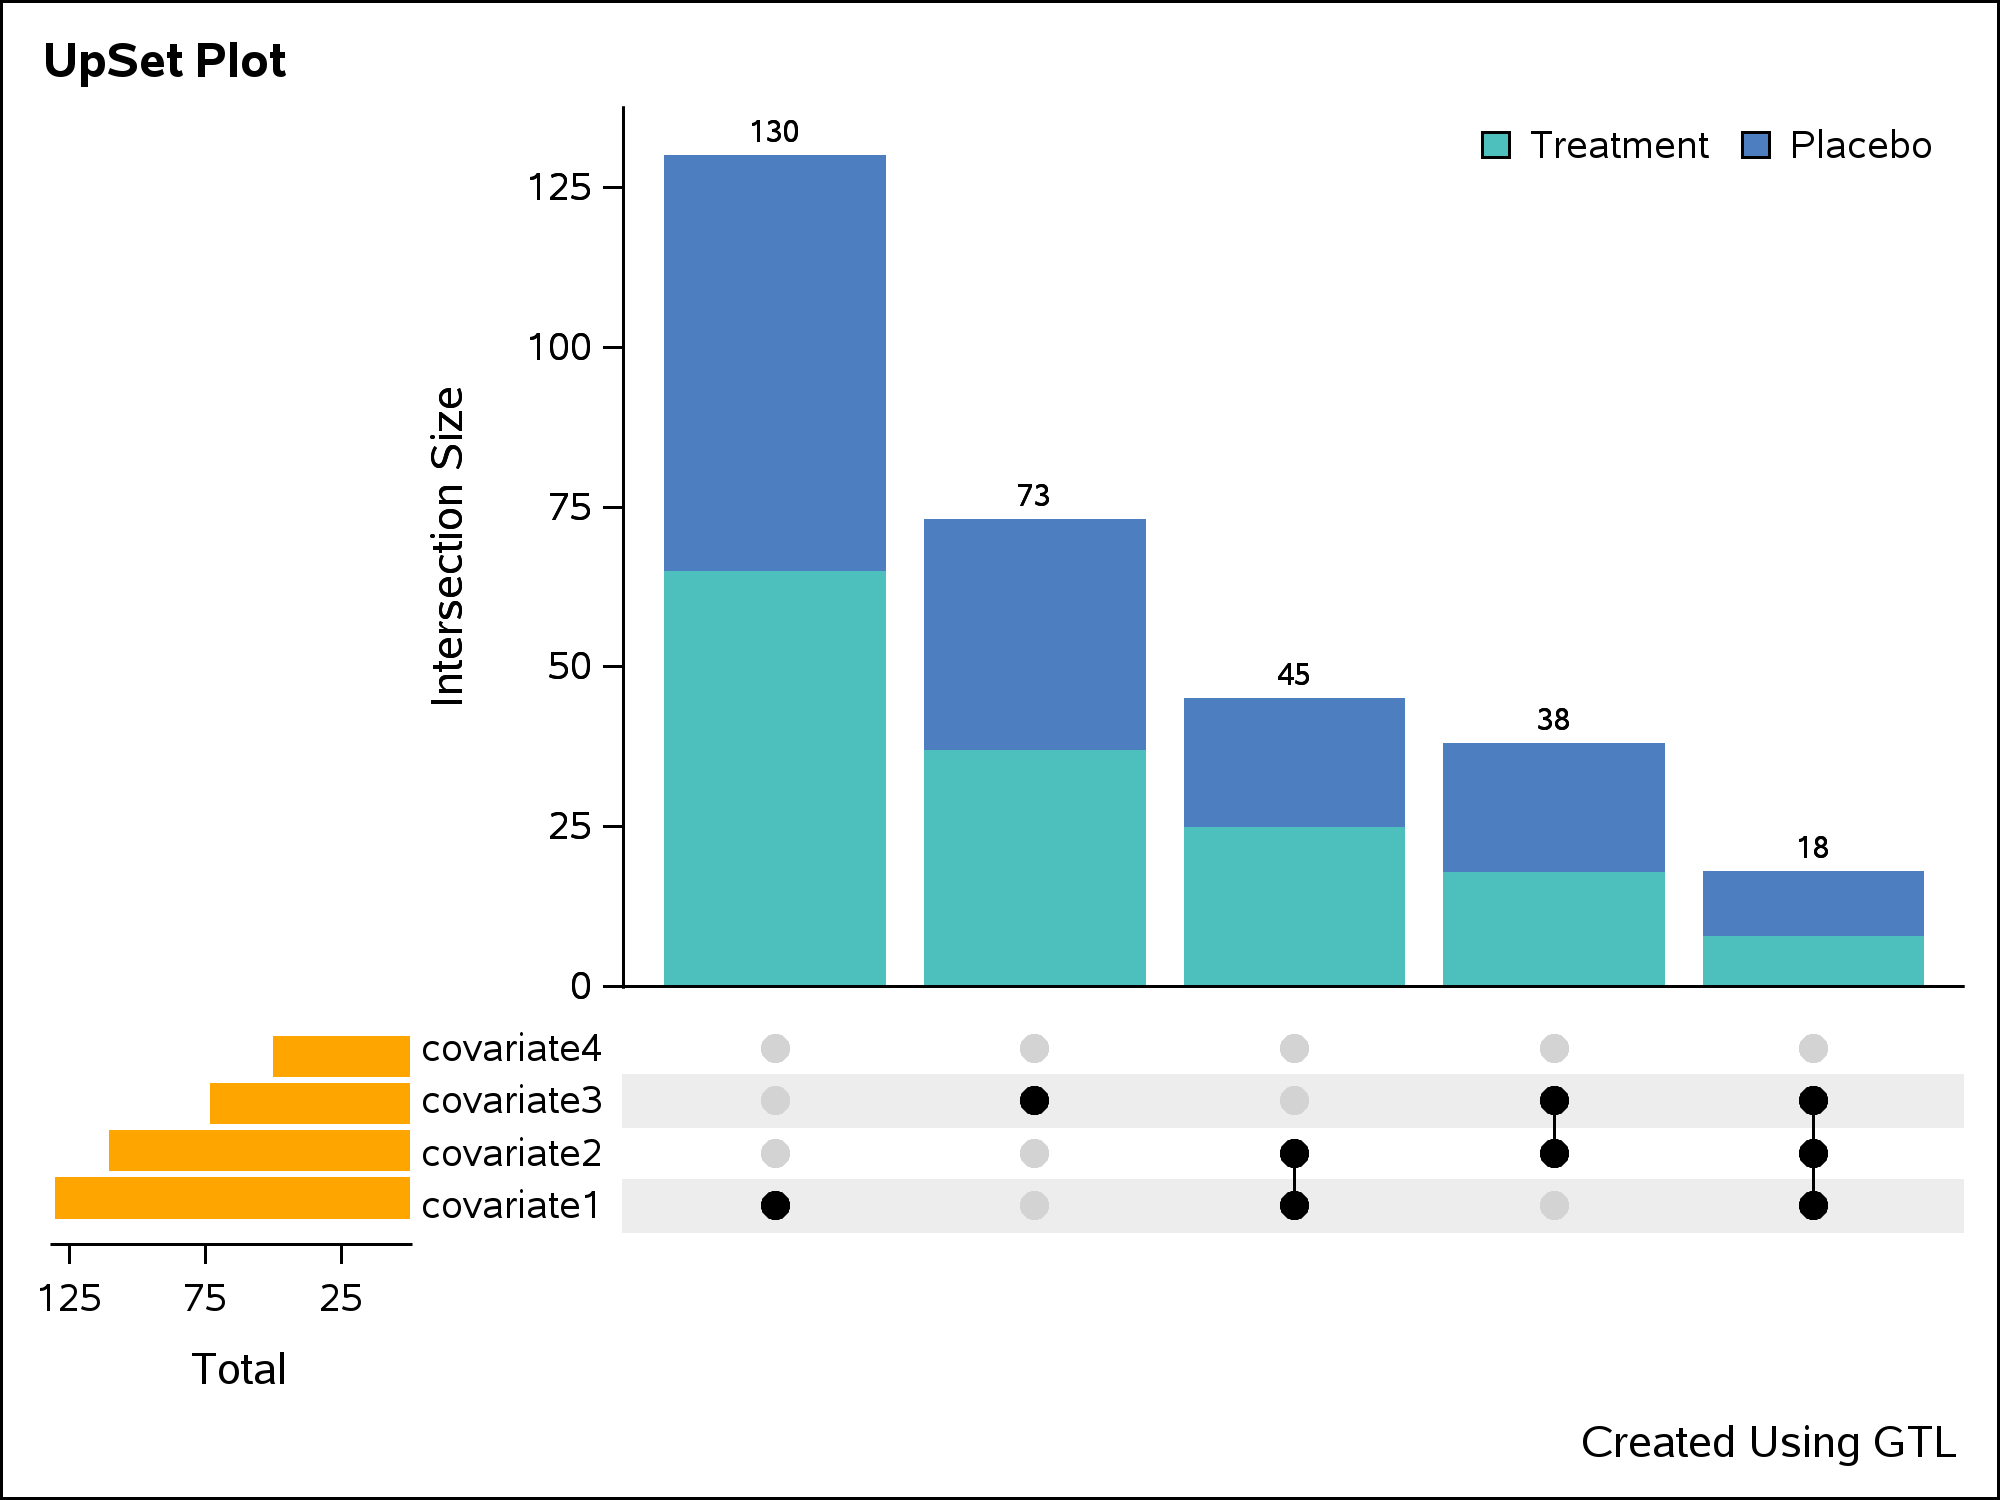
UpSet Plot using GTL

An UpSet plot is used to visualize intersections of sets. In this post, we will illustrate techniques to create this plot using the Graph Template Language (GTL). We assume that you are familiar with GTL. From the point of view of construction, we leverage the LATTICE layout available in GTL