SAS Viya: ビジュアルパイプラインで需要分類&予測
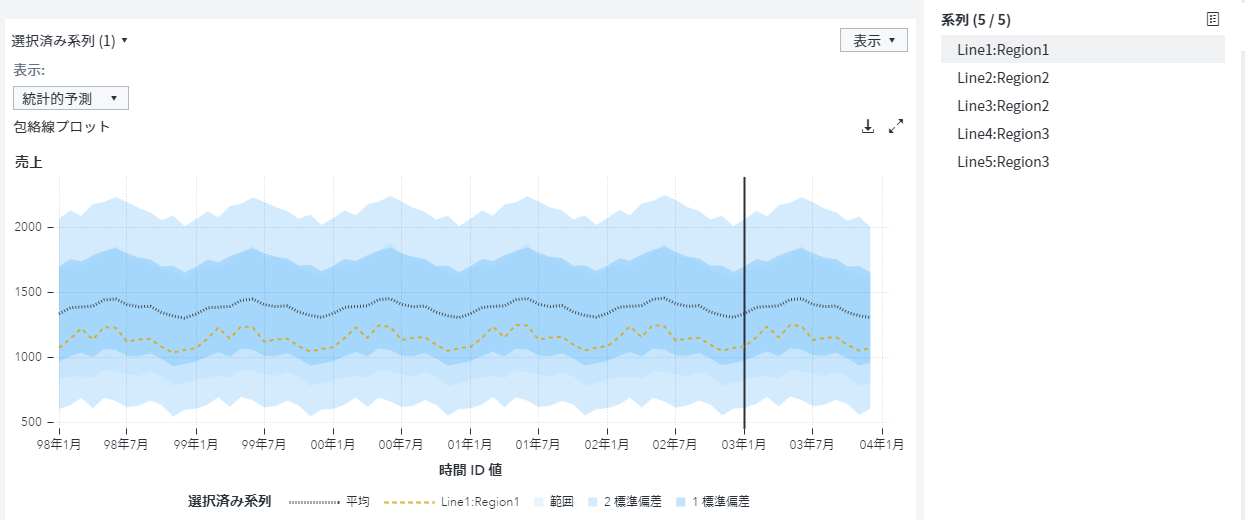
「ビジュアルパイプラインで将来予測」では、SAS ViyaのModel Studioを使用した時系列予測の基本的な手順を紹介しました。 今回は、需要予測の精度を高める代表的な一つの手法として、需要分類をご紹介します。 例えば、お菓子の販売に関する需要を予測する場合を考えてみましょう。 ポテトチップスやおかきのように通年を通して売れる商品もあれば、アイスクリームのように夏季に需要が増加する商品、チョコレートのようにバレンタインデーの直前と当日に需要が急増する商品、お盆やお彼岸などの際にお供え用にときどき購入される商品などなど、お菓子の種類によって需要のパターンは異なってきます。 これらの異なる需要パターンの商品に対して、一律同じアルゴリズムを適用しても予測精度は高まりません。 こうした課題に対処するために、SAS Viyaの時系列予測では、自動的に需要のパターンを分析し、予測の精度を高めるような仕組みも搭載されています。 SAS ViyaのModel Studioで時系列予測を実行する際に、需要分類を活用する場合は、「需要の分類」テンプレートを使用します。 (使用する時系列データやデータ内の変数に対する役割設定内容は、「ビジュアルパイプラインで将来予測」ブログ内容と同様です。) 以下は、「需要の分類」パイプライン・テンプレートを選択し、実行した後の画面です。 「需要の分類プロファイル」ノードでは、統計解析等の手法を使用して、時系列データを解析し、需要のパターンを検出します。冒頭にお話しした通り、予測対象によって需要のパターンは様々です。 こうした多様なパターンを見極めた上で、適した予測アルゴリズムを用いることが肝要になります。 今回のデータでは、地域×製品ラインのセグメントごとに需要のパターンが検出され、分類されます。 「需要の分類プロファイル」ノードのメニューから「開く」を選択すると、 分類結果が表示されます。 地域×製品ラインでは、5つの組み合わせ=セグメントが存在するので、これらのセグメントごとにパターンが検出され、結果としては、1つのセグメントは「YEAR_ROUND_NON_SEASONAL:長期間の非季節性需要」として、4つのセグメントは「YEAR_ROUND_SEASONAL:長期間の季節性需要」として分類されていることがわかります。 上記の2種類を含め10種類の需要パターン+その他、に分類されます。 次の「需要の分類モデリング」ノードでは、分類されたセグメントごとに最適なアルゴリズムが選択され、予測が実行されます。 「需要の分類モデリング」ノードのメニューから「開く」を選択すると、 実行結果が表示されます。検出された需要パターンに応じて、最適なアルゴリズムを適用したパイプライン(以下の「パプライン」列)が選択され、実行されます。 「YEAR_ROUND_NON_SEASONAL:長期間の非季節性需要」のセグメントには「非季節予測」モデルのパイプライン・テンプレートが適用され、「YEAR_ROUND_SEASONAL:長期間の季節性需要」のセグメントには「季節予測」モデルのパイプライン・テンプレートが適用され、それぞれ実行されています。「WMAPE」列には加重MAPEの値が表示されています。 セグメントを選択し、画面右上の「パイプラインを開く」アイコンをクリックすると、 そのセグメントに適用され、実行されたパイプラインが表示されます。 加重MAPEの値や、このパイプラインの予測結果を確認し、精度をさらに改善したい場合は、従来通りの操作性でこのパイプラインをカスタイズ(アルゴリズムを変更したり、パラメータをチューニングしたり)することもできます。 最後の「セグメントのマージ」ノードでは、各セグメントの予測実行結果をマージします。 「セグメントのマージ」ノードのメニューから「予測ビューア」を選択すると、 予測結果のチャートが表示されます。 以下チャート内のオレンジ色の破線は、5つのセグメントの中の、地域:Region1×製品ライン:Line1に関する予測結果です。 以上のように、SAS ViyaのModel Studio上でビジュアルパイプラインを用いた時系列予測では、需要のパターンに基づく、より精度の高い予測モデリング戦略の自動実行も可能なんですね。 ※ビジュアルパイプラインでの需要分類&予測は、SAS Viya特設サイト内の「ビジュアライゼーション」及び「機械学習」セクションにて動画をご覧いただけます。 ※需要予測精度の向上に関しては、「ビジネスで「需要予測機能」を活用するために必要な3つの要素」ブログも参考にしてください。 ※Enterprise Open Analytics Platform 「SAS Viya」 を知りたいなら「特設サイト」へGO!