In this blog, I use data from the U.S. Department of State "Trafficking in Persons" (TIP) reports for the years 2013-2017 to accomplish these objectives: 1) To determine what are the main themes in TIP reports, and 2) to show how to work with ASTORE code to deploy models using SAS Visual Text Analytics 8.4.
In SAS Visual Text Analytics (VTA), a Topic is a collection of terms that describe a main theme. The Topics node in VTA uses Machine Learning techniques to automatically generate and assign topics to documents. VTA Topics are derived from natural groupings of important terms in the documents and a document can have one or more Topics.
The deployment and monitoring of analytical models are key steps in the Analytical Life Cycle. Continuous monitoring and recalibration of models allow us to make empirically based business decisions. A common industry standard modeling output is to produce score code which is used to deploy the analytical models developed for production level usage by the business. Using SAS Viya products, we can implement all the steps of the Analytical Life Cycle.
In his SAS Global Forum paper, The Aftermath What Happens After You Deploy Your Models and Decisions, David Duling mentions that the SAS ASTORE files:
- Package all the model structure information into a single binary file that can be used to later score new data.
- Can be executed in a SAS program, a DS2 program or in a CAS action.
- Are portable and can be used in all scoring services produced by SAS (SAS, CAS, INDB, MAS and ESP).
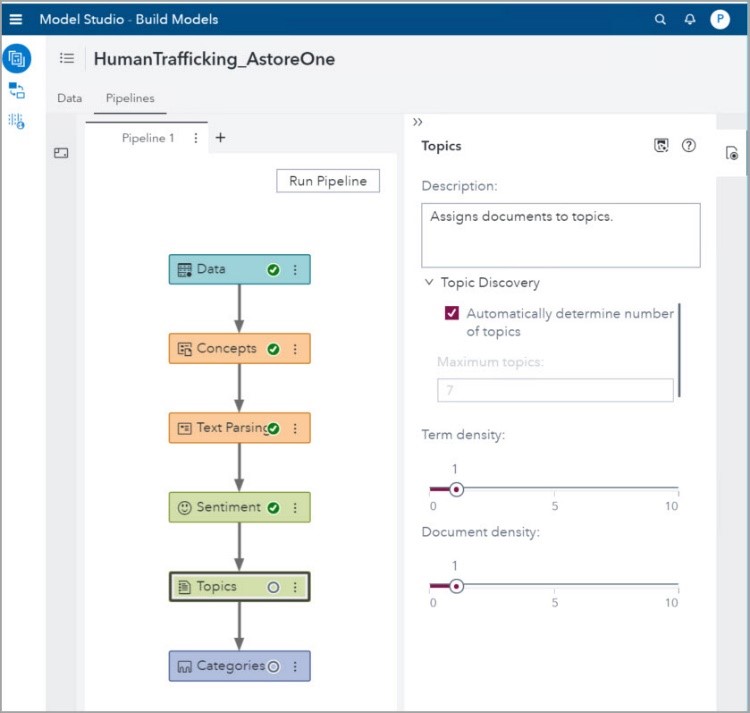
In this blog, I will outline how to obtain the ASTORE score code from the Topics node of the SAS Visual Text Analytics (VTA) pipeline and run the score code with a new data set. To accomplish these tasks, I separate the 2013-2017 data in two data sets, one with data from 2013-2016 and another with data from 2017. I use the first data set to build training models in the Topics node. Then, I score the second data set using the ASTORE score code produced in the Topics node. The screenshot below shows the corresponding pipeline; its Concepts node has the Custom Concepts that I built in my blog, Using machine learning in SAS Visual Text Analytics to analyze Human Trafficking reports:
Main themes in the TIP reports
The default settings for Topics Discovery, Term Density and Document Density are shown in the previous screenshot. Using these default settings is the best practice for working with this node. One can let VTA Automatically determine the number of topics or indicate the Maximum number of topics we want VTA to generate.
The purpose of the term and document density settings is to fine tune the threshold by which you decide to assign a term to a topic definition or assign a document to a topic respectively. When Term Density has a small value, you find larger sets of more loosely associated terms that define a Topic. As you increase the value of Term Density, you find smaller sets of more tightly coupled terms that define a Topic.
There is no right or wrong answer here. Accuracy is driven by if the output is meeting your business questions and needs and the process relies heavily on experimentation and inspection based on your requirements. Use a high value for Document Density when you want documents that map very strongly to a topic, and a small value when If you want documents with a small indication of the topic in the document.
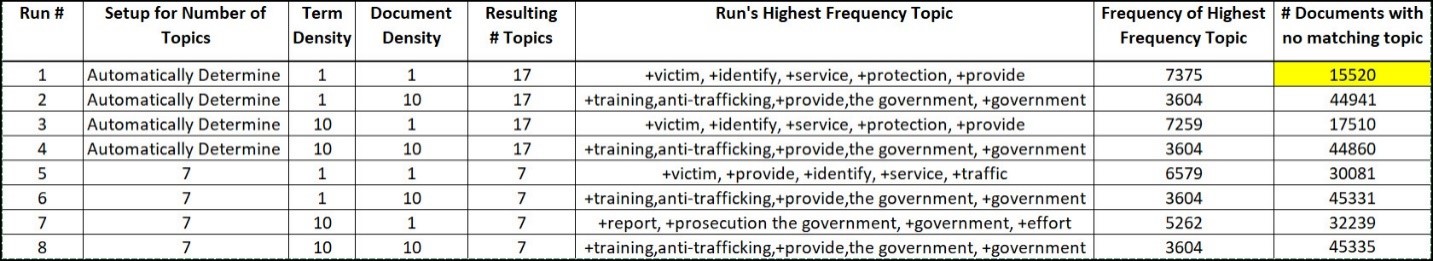
To see how Term Density and Document Density work, I did eight runs varying the option settings in the Topics node. The results are compiled in this table:
Notice:
- The yellow highlighted value, 15,520 which indicates the number of documents with no matching topics. For this blog, I wanted to match as many documents to topics as I could, therefore for my needs, these are my best configuration options.
- If Document Density equals 10, then the number of matching topics is very high (as expected).
- Highest frequency topic is dependent on the value for Term Density, and not on Document Density. Also, this topic is different when Term Density = 1 from when Term Density =10.
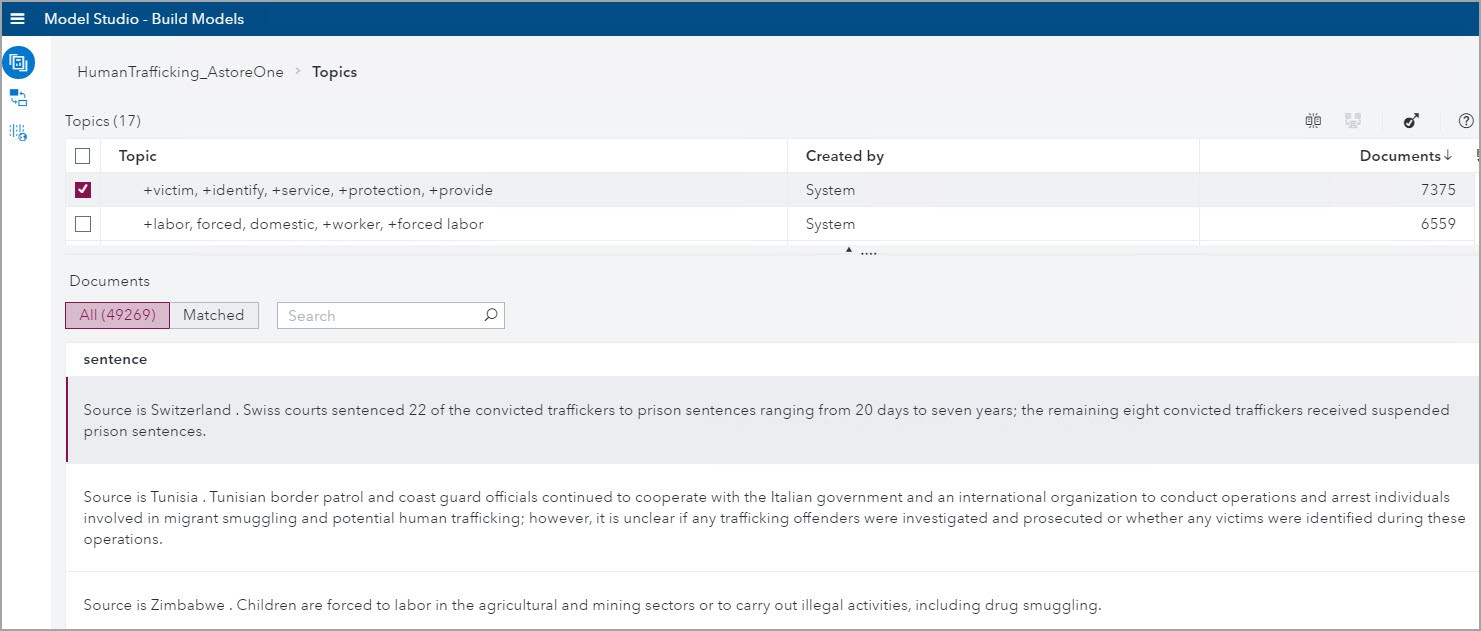
As mentioned above, the Topics node in VTA uses Machine Learning techniques to automatically generate and assign Topics to documents. The screenshot below shows the 10 most frequent Topics in the TIPS reports. In this screenshot we can see that there are 17 Topics automatically generated.
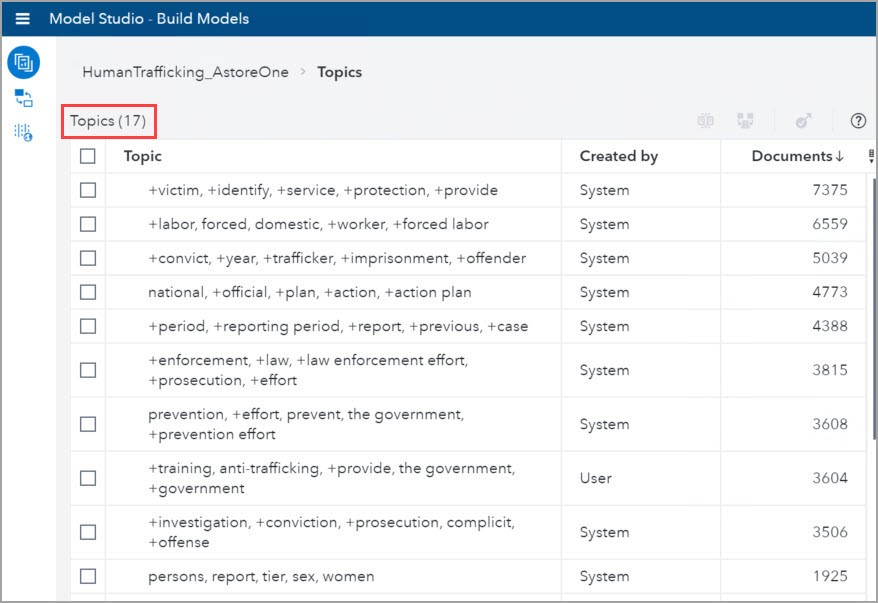
To see the Matched documents, select the check box next to the topic and click on the Matched tab. In the below screenshot I show the matching TIP reports to the first Topic: +victim, +identify, +service, +protection, +provide.
Topics Node Results
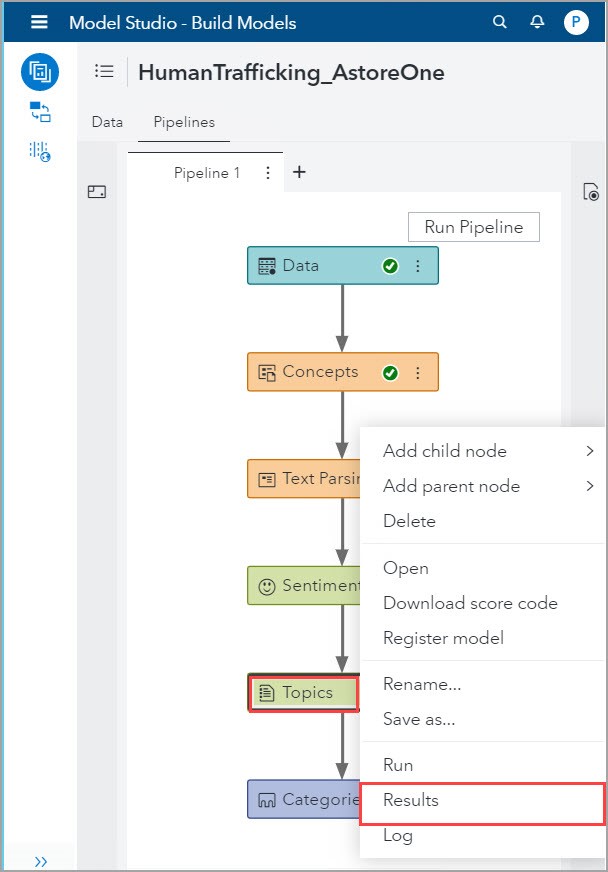
From the Pipeline tab, right-click on the Topics node and select Results:
The Summary tab contains two items:
- A graph of the Number of Documents per Topic, which includes the number of documents which do not have a matching Topic, and
-
The Astore Score Code, which one can copy and paste in SAS Studio 5 as described in the next section The ASTORE Score Code.
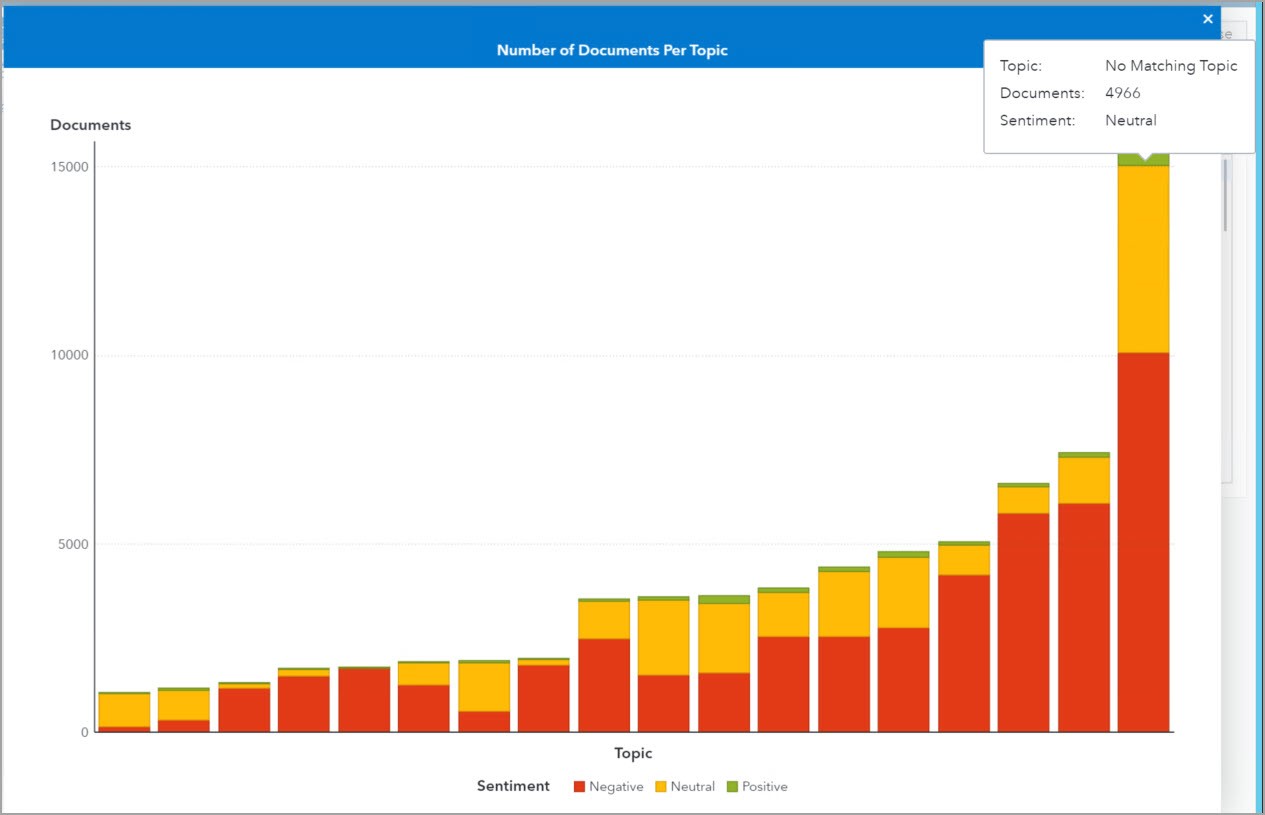
Just as a quick usage note, I included the sentiment node in the Pipeline, and this is why this bar chart is stacked by sentiment. Notice that the overall Sentiment in the TIP reports is negative as indicated by the red color, and that by hovering over each bar one can see the corresponding Topic to the bar. The screenshot shows that there are 4966 documents with a neutral Sentiment which do not have a matching Topic.
Having more than 15,000 TIP records that are not assigned to any of the 17 Topics generated is an indication that more work can be done in the Concepts and Topics nodes.
ASTORE score code
Recall that the ASTORE Score code packages all the model structure information so that it can be run against other data and scored. In our current Pipeline, I am using the TIP records for the years 2013-2016, but now I want to use the ASTORE code to score new data for the year 2017.
Download the ASTORE score code
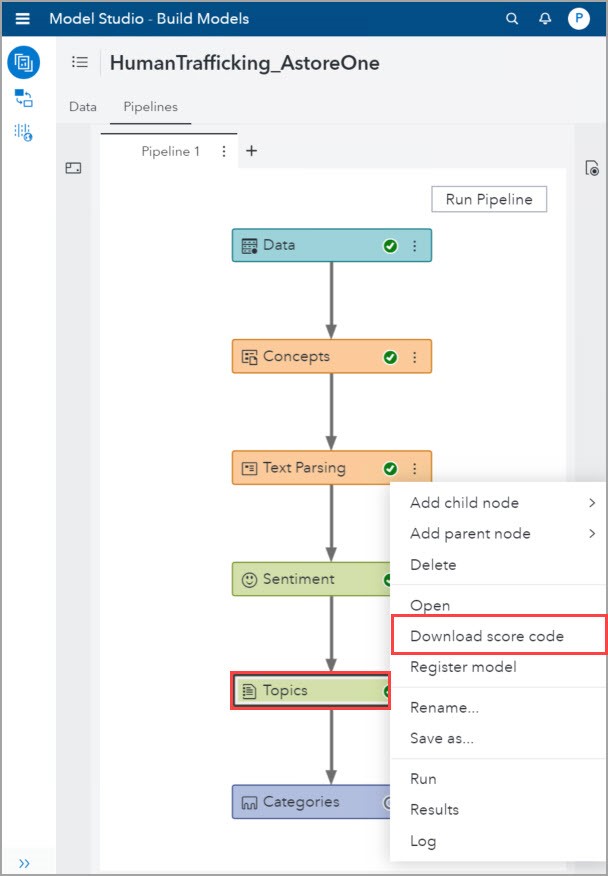
Back in the Pipeline tab, right-click in the Topics node and select Download score code.
A zip file which contains the model score code will be automatically downloaded to the client. In that zip file there are two files: AstoreScoreCode.sas and TopisModel.astore.
Run the ASTORE score code in Studio 5
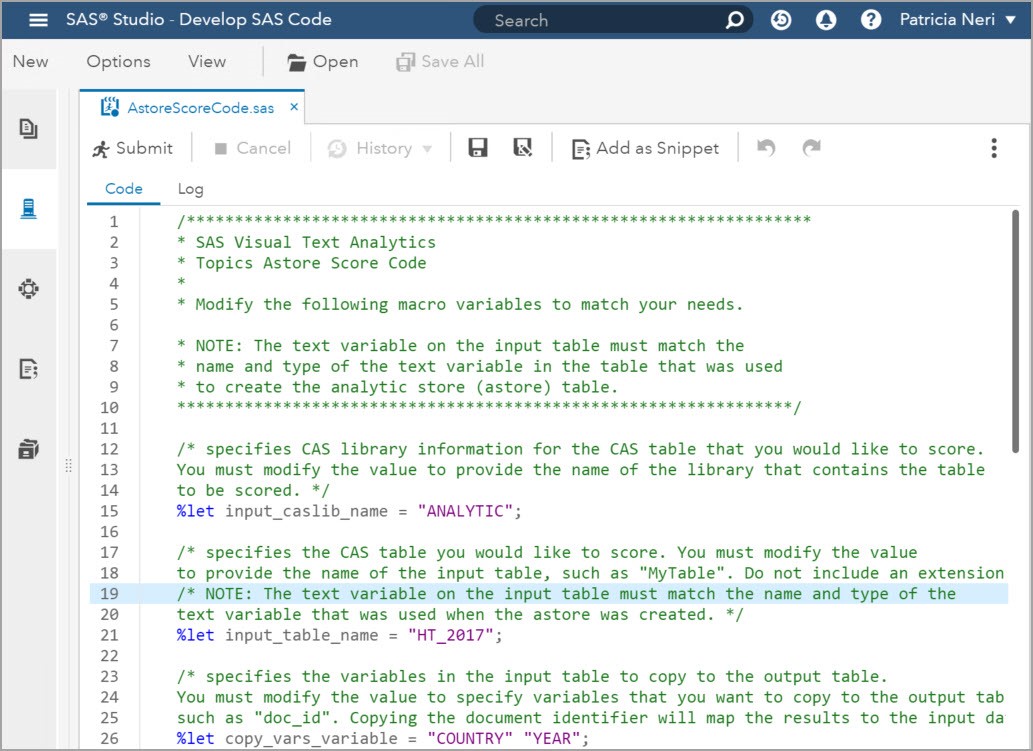
Open the AstoreScoreCode.sas, copy and paste it into SAS Studio 5. We will now need to go through the code and make changes to use our 2017 data. In the first five lines of code that start with %let, substitute the strings as shown in the table below:
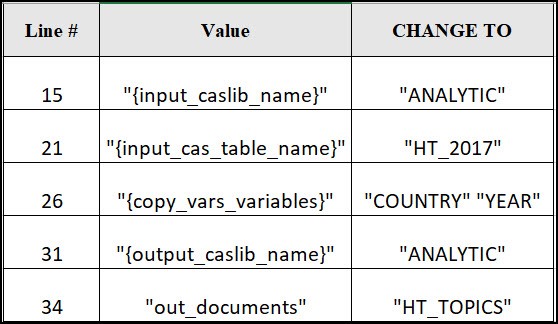
Here is what the code with those changes looks like. The green text in the screenshot are comments and you can see the %let statements on the line numbers I indicated in the table above.
Promoting CAS table with results
In order to see the table with results of scoring the new data for 2017, I promoted the table that has the results. I added these lines after the Astore Score Code in SAS Studio 5:
proc casutil; promote casdata="HT_TOPICS" Incaslib="ANALYTIC" Outcaslib="ANALYTIC" CASOUT="HT_TOPICS"; run; |
Analyzing the results
The table HT_TOPICS has the results of applying the Topics ASTORE score code to the TIP reports for the year 2017. As expected, there are 14,379 rows where each row corresponds to a TIP report. In each row, we can see the linear combination of Topics to the TIP report and which Topics are most relevant to each TIP report.
Because there are 17 Topics automatically generated, the resulting table HT_TOPICS has:
- One column _Index_ that indicates the corresponding TIP record in the input table
- 17 columns (columns 2 to 18) which correspond to the scores for each Topic for the TIP record in that row
- 17 columns (columns 19 to 24) which indicate to which Topic the report is assigned
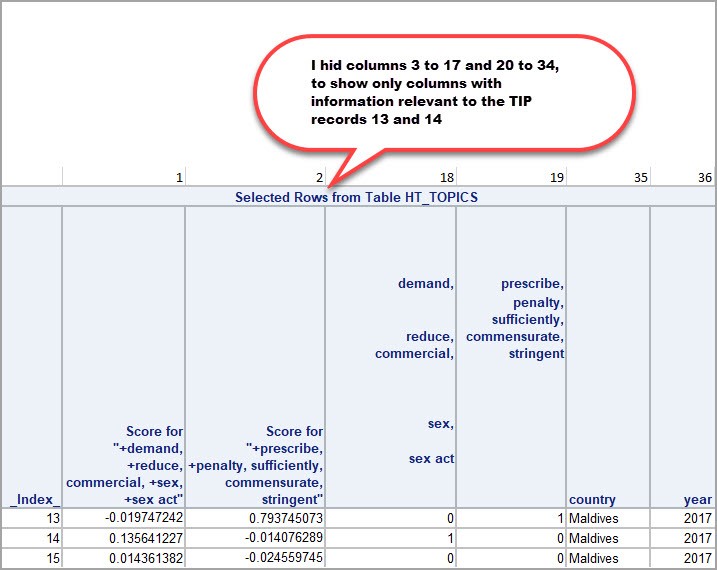
- Two columns (columns 35 and 36) which correspond to Country and Year as requested by the macro variable “{copy_vars_variables}”
Looking at the following screenshot will make this paragraph clearer, I used a subset of columns and rows to illustrate the point. The screenshot shows the columns _Index_, Score for Topic #1, Score for Topic #2, and that the TIP record with Index 13 is assigned to the 2nd Topic. Also, the screenshot shows the scores for Topics #1 and #2 for the TIP record with Index 14 which is assigned to Topic #1. The TIP record with Index 15 is not assigned to Topics #1 nor #2, it is assigned to another Topic whose column is not included in the screenshot.
Conclusion
Using the automatic settings in SAS Visual Text Analytics, we can find the main themes in the TIP reports, and quickly develop insights.
SAS Viya facilitates the implementation of the whole Analytical Life Cycle. One of the steps in this cycle is the deployment of models, which can be done using ASTORE score code. In this blog, I showed how to obtain the ASTORE score code for the Topics node in SAS Visual Text Analytics, how to work with it and interpret its results.
Next steps
Read the references provided in this blog to understand the great capabilities provided in SAS Viya: