Technological advancements are changing every industry – and the health care industry is no exception. The value of AI has never been greater than when it’s used to improve patients’ conditions and save lives.
For example, Cancer Center Amsterdam joined forces with SAS to improve patient care outcomes with AI. The project clinically diagnoses patients with colorectal liver cancer, the third most common cancer worldwide, using computer vision and predictive analysis. Previously, this process required manual examinations. Automating this process has increased accuracy and saved time to ensure patient survival.
Whether it’s image analysis to detect cancer or other diseases immediately, predictive analytics to ensure availability of doctors and hospital beds, or using NLP to understand lengthy patient reports, the potential for technological enhancement in health care is enormous.
Stent failure overview
SAS will host a virtual Data Science Experience Day on July 23. I look forward to presenting how machine learning is used to reduce the risk of heart attacks by predicting stent failure. A stent is a small tube that doctors can place in a blocked artery to help restore healthy blood flow. Stents keep coronary arteries open and reduce the chance of a heart attack. Predicting the main drivers of stent device failure using advanced algorithms allows us to continuously improve treatment and patient safety.
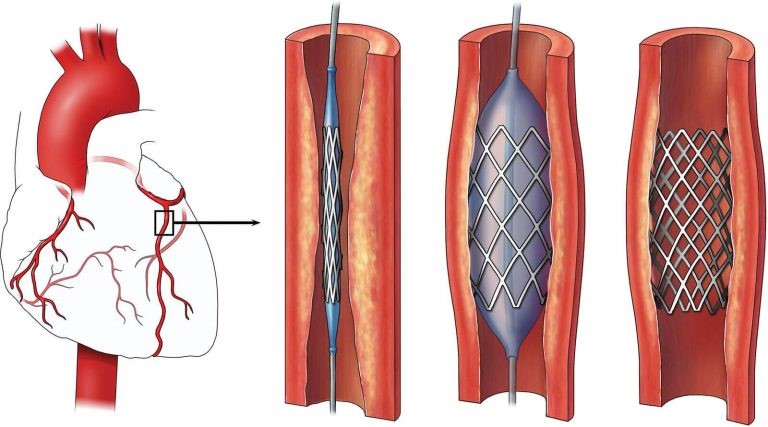
Figure 1. Stent with a balloon can be inserted into a blood vessel in the heart. After the balloon is removed, the stent keeps the vessel open.
Case study: Predicting stent failure using machine learning
So how can we do that? We will be using SAS Viya to create a visual report and compare several supervised machine learning algorithms, such as logistic regression, gradient boosting and neural networks. The data set will include variables about the patient (age, gender, smoker, diabetic, etc.), the stent (length, material, type, design, etc.) and other effects (hospital). During my session at the online event, we will go deeper into detail on how we prepare and explore the data, as well as discuss how we can make our models more accurate. However, for this post, we will just look into the principles of the method to predict stent failure.
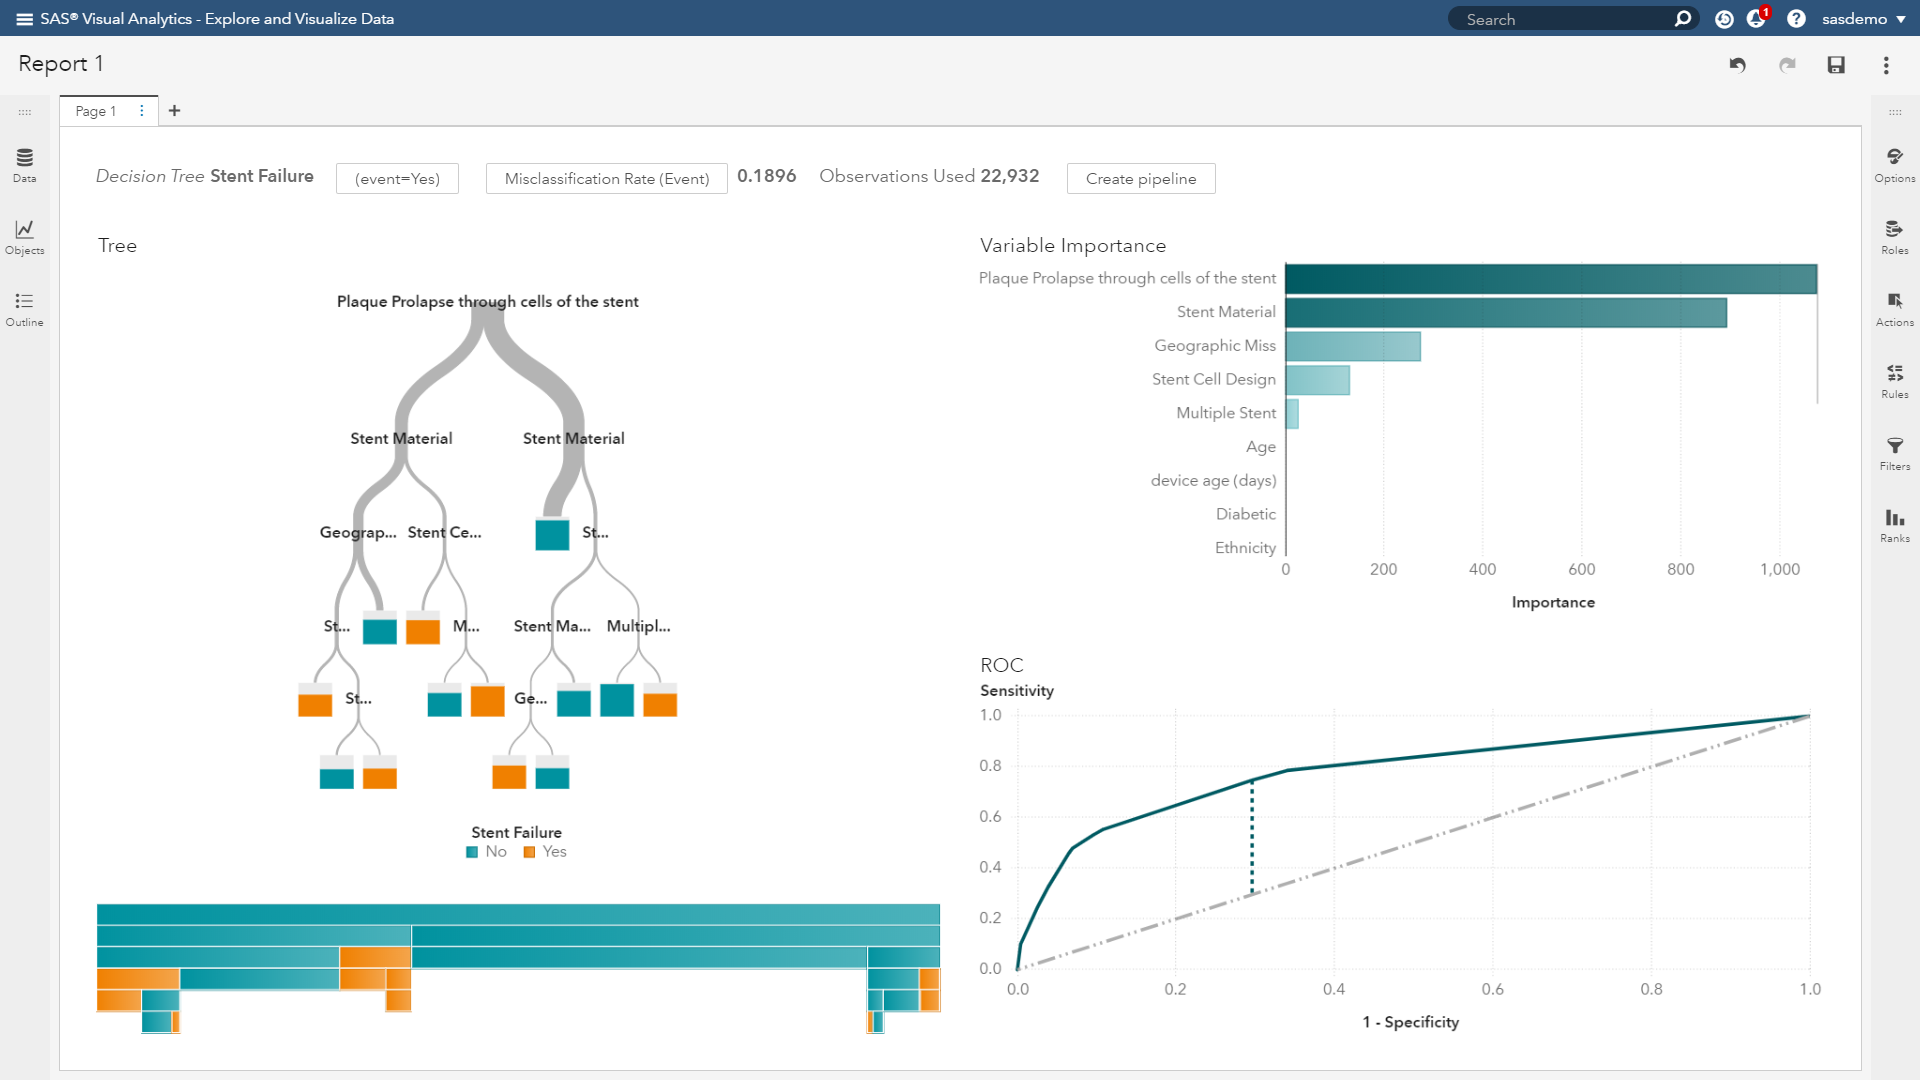
Firstly, we want to explore a decision tree from the objects panel and include all the variables. This allows us to classify the variables to study the variable importance. From this decision tree, we can see a misclassification rate of 0.1896 – which means that this model can accurately predict roughly 81% of the cases which leads to a stent failure. We can see variables such as Plaque Prolapse cells of the stent and Stent Material are the top two significant variables in determining stent failure. Simply speaking, we could dive deeper into which material has a high failure rate and improve, or even eliminate, that material.
In the options panel (top right), we can optimise our parameter to get an improved model. For example, we can change the maximum branches from the default two to three. This would decrease our misclassification rate to 0.1866 and slightly improve our model. Our aim in this session is to minimise the misclassification rate.
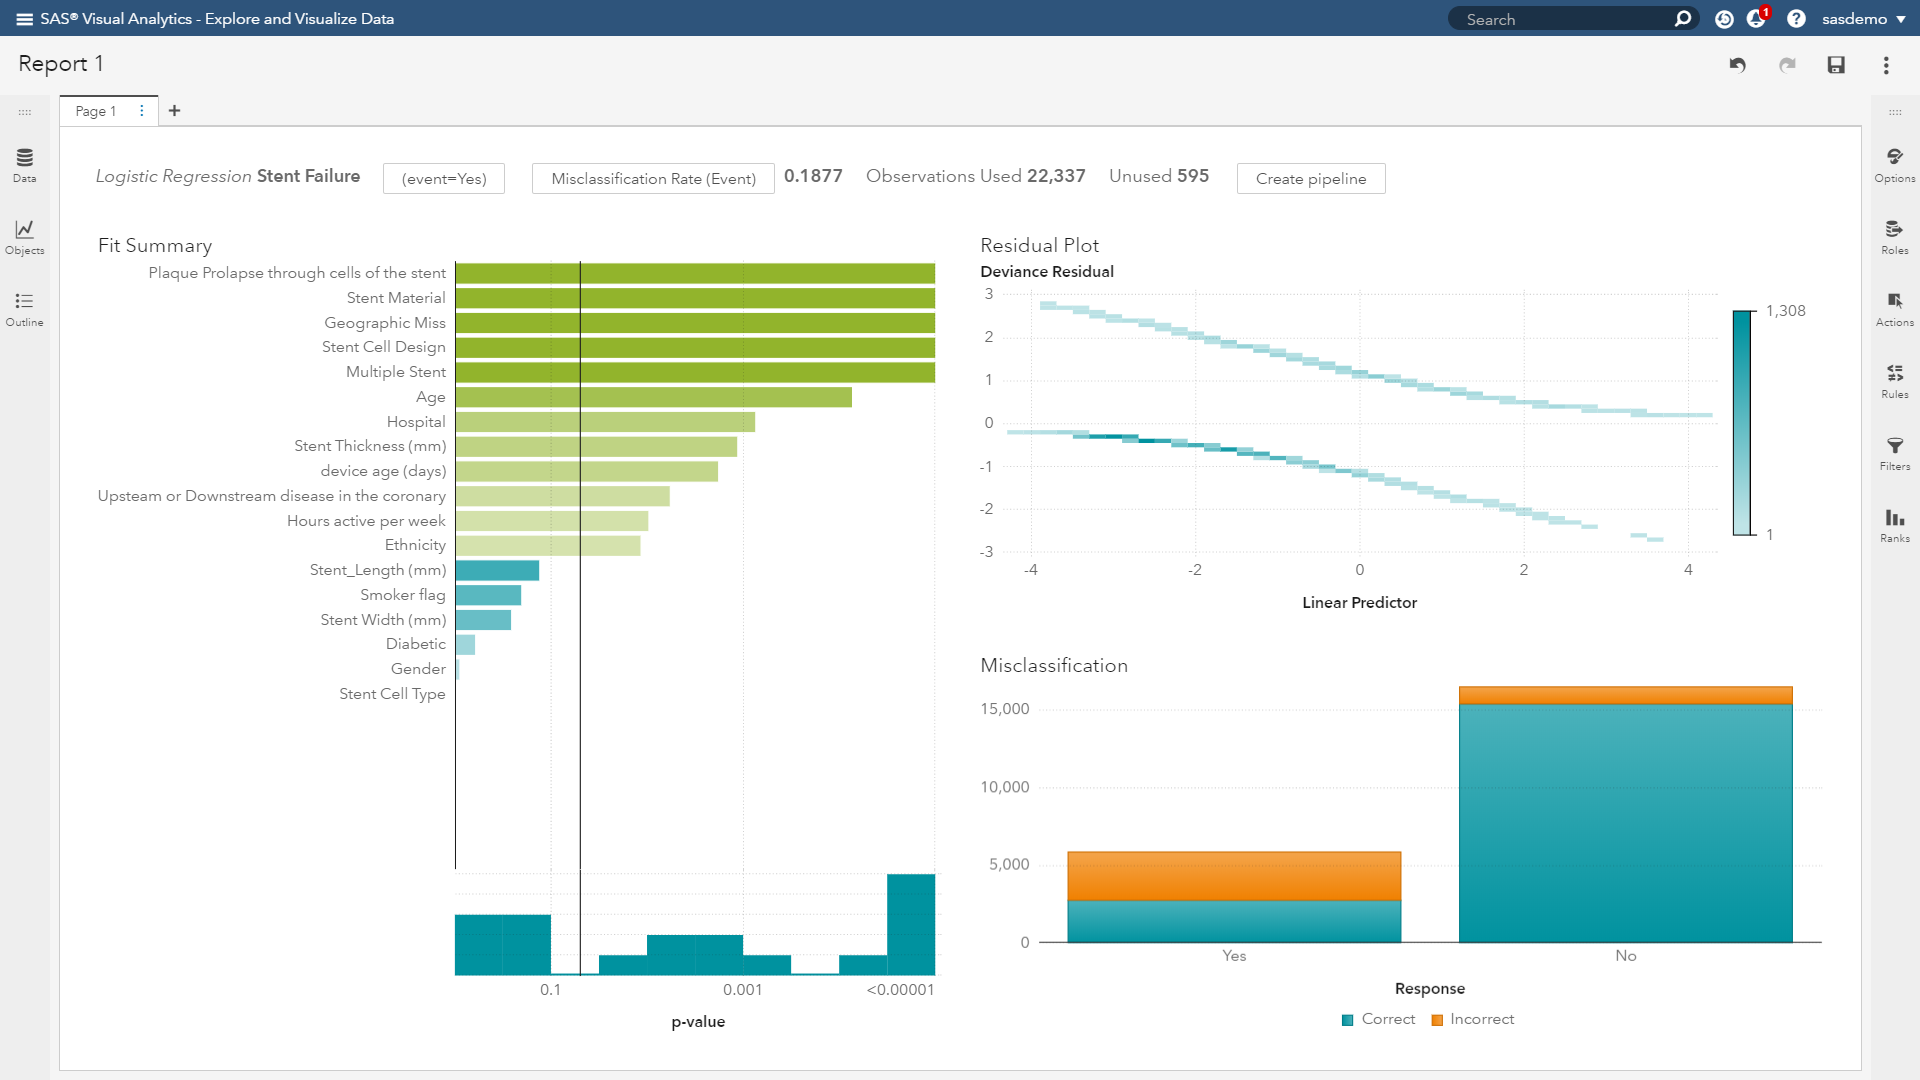
Since we are trying to predict a binary outcome (failure/nonfailure), another machine learning technique we could use is logistic regression. This algorithm is a simple, fast, yet powerful classification algorithm. If you are worried about which machine learning algorithms you should use, we will discuss that during my live session at the Data Science Online Event. Until then, a good starting point can be found here.
We can see that logistic regression produces a slightly improved misclassification rate of 0.1877. This again shows which variables are statistically significant in determining whether the stent device fails by displaying its p-value.
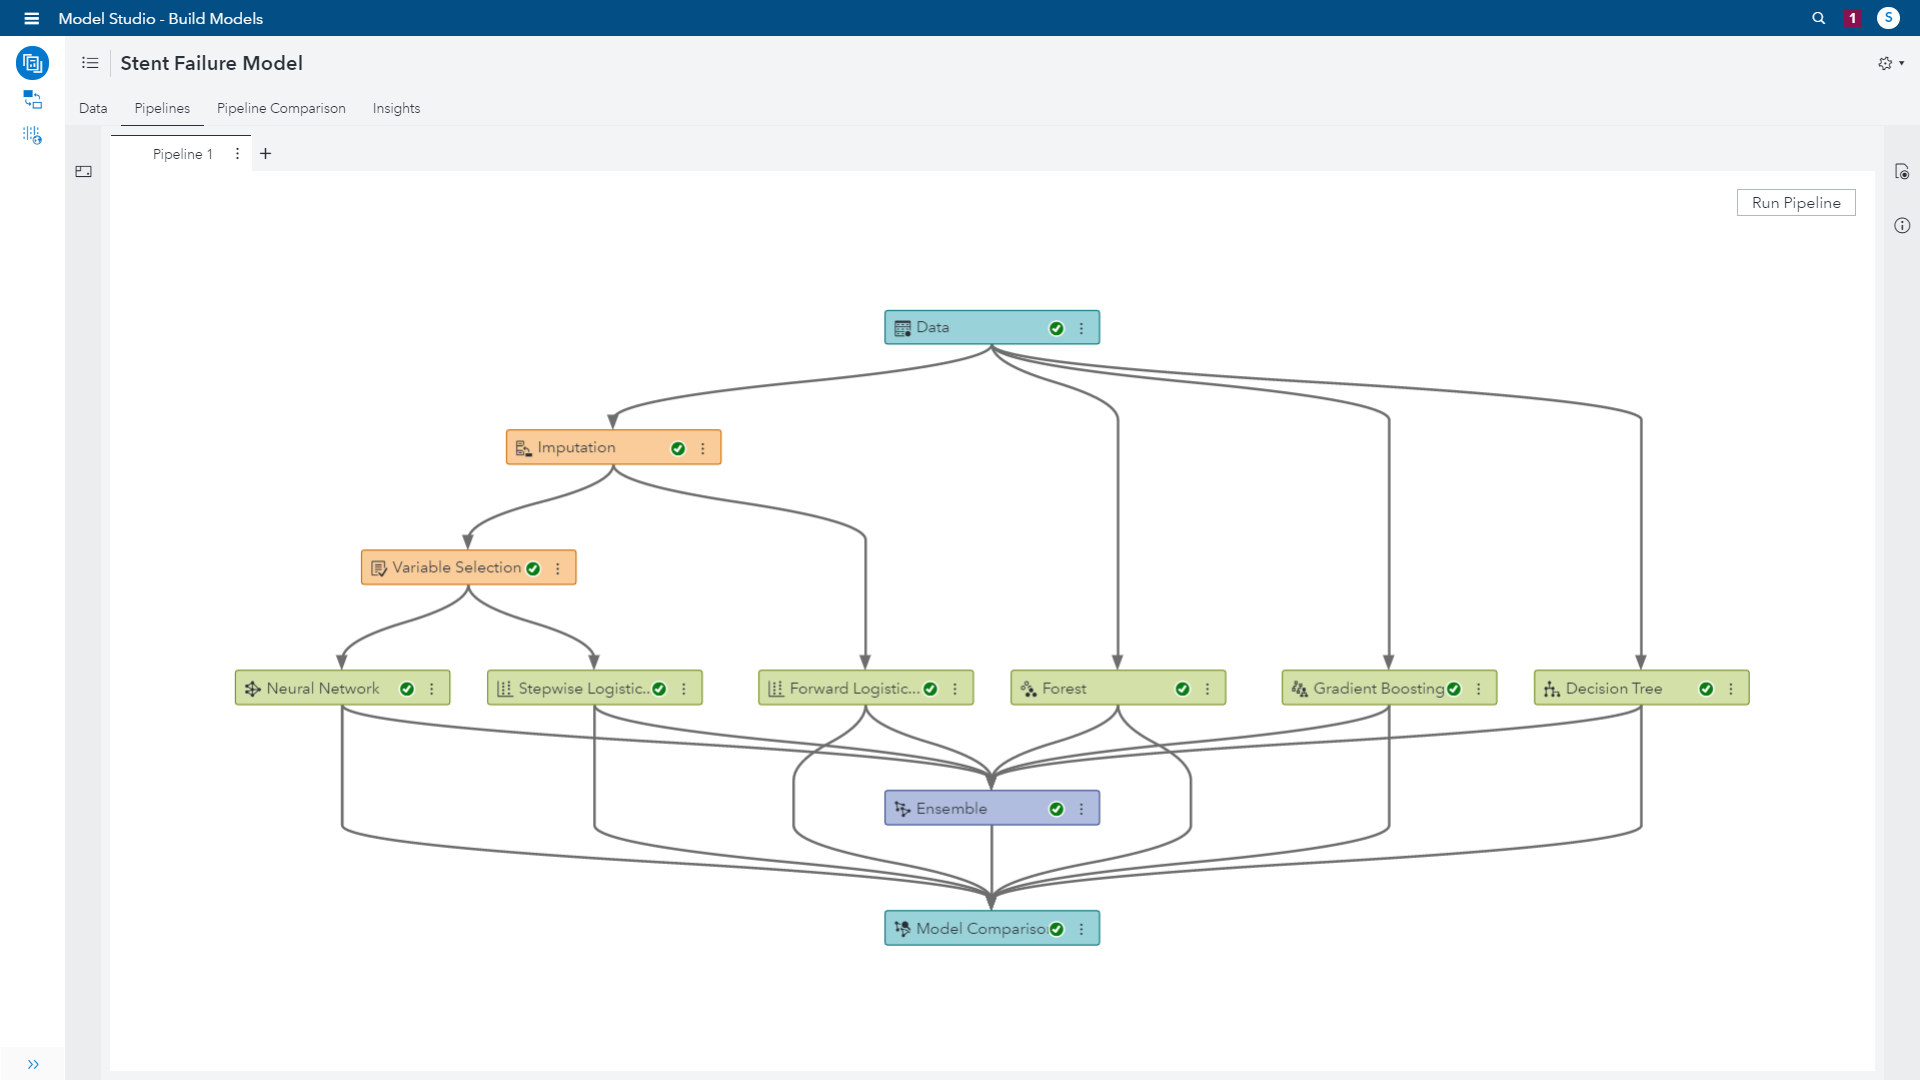
This process is great to look at single models and study the results. However, in a business process, we would like to compare several models and get detailed insights. Thus we will move onto a "modelling studio" that can help us develop the entire end-to-end analytics life cycle in the form of a "pipeline" (an intelligent process flow).
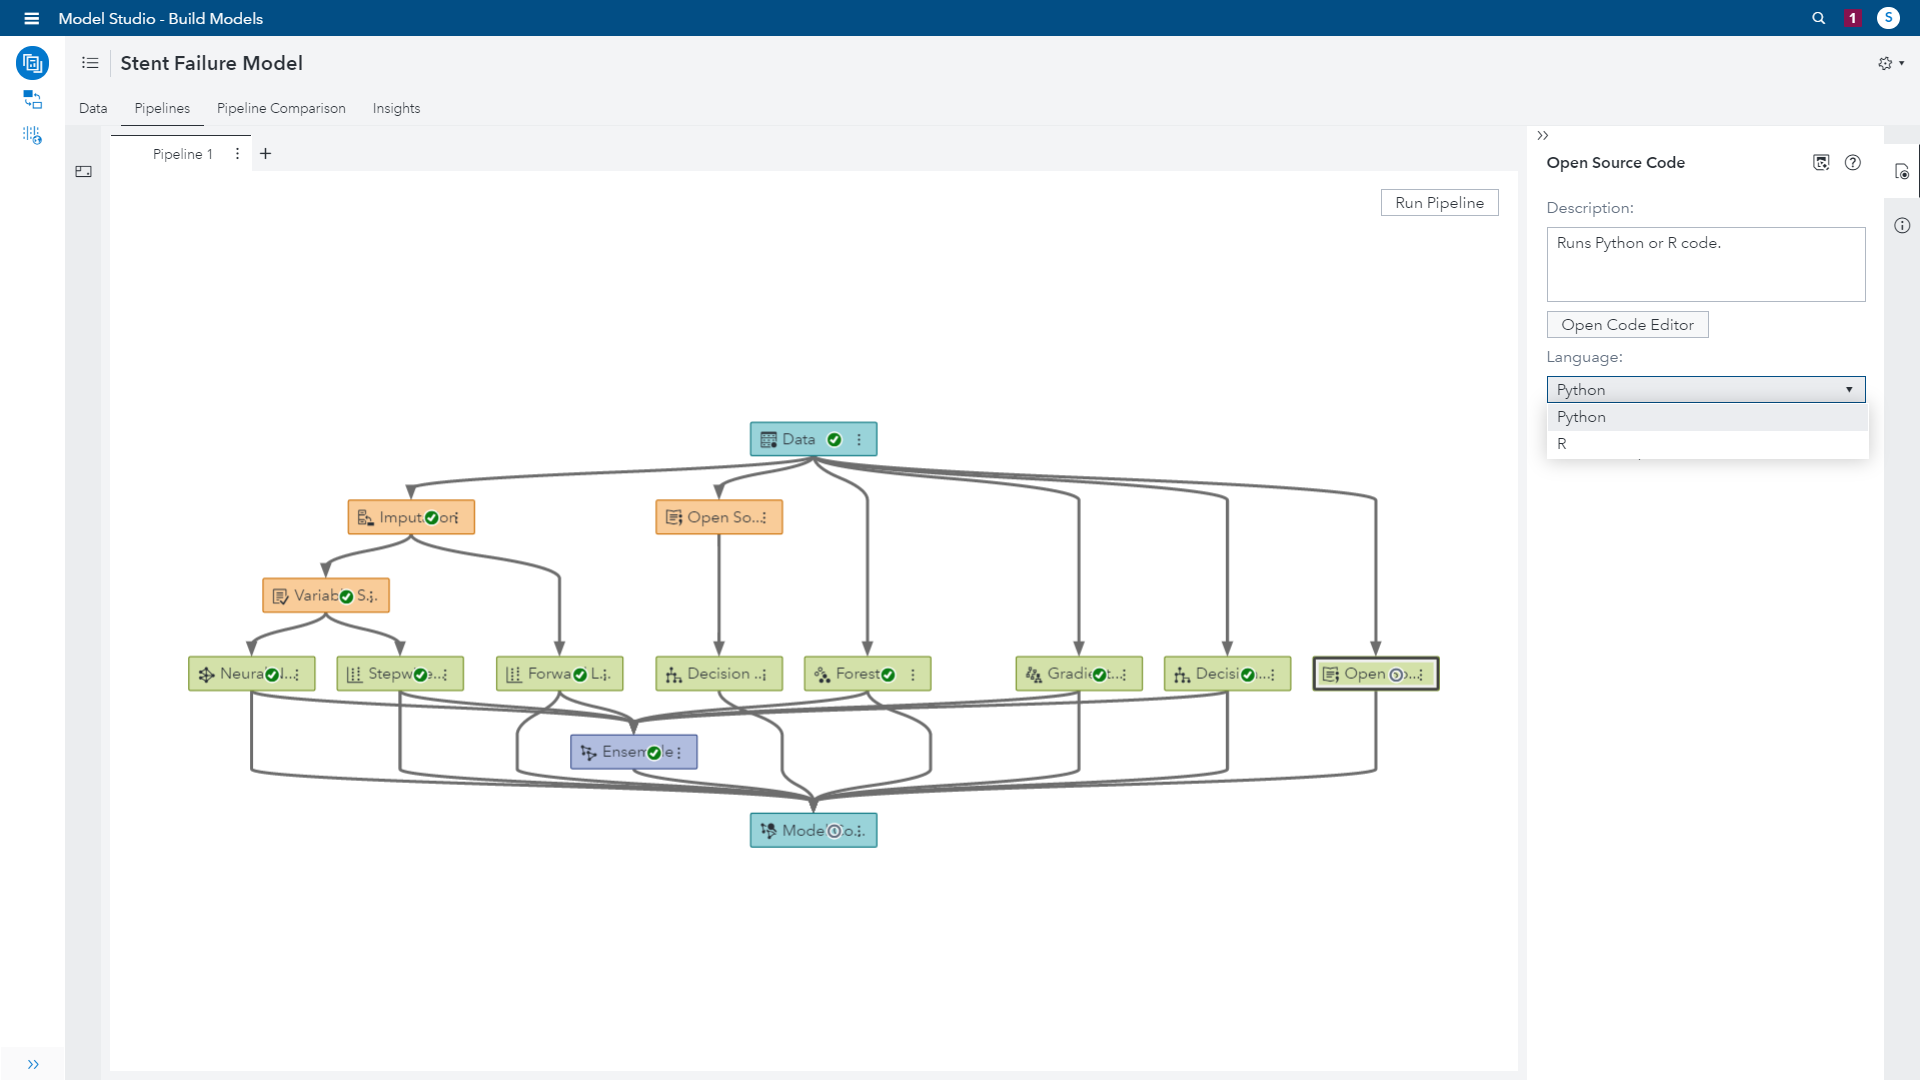
In this process, we can see that we can easily drag and drop data mining preprocessed to prepare the data for modelling (e.g., we will use the Imputation node to replace missing data to improve data quality and model accuracy, and use Variable Selection to choose the best variables for analysis). We can then select which machine learning technique we wish to use, and we’re able to adapt those too.
SAS loves open source
So far, we’ve been using SAS (code) throughout this exercise. However, SAS embraces open source and allows you to use whatever language you prefer. You can do your own data mining via Python or R code and then use the machine learning techniques. Or you could create an entire process on open source and compare it against the SAS models to pick the best one.
Flexibility is at the forefront of what we want to achieve, and SAS Viya allows that.
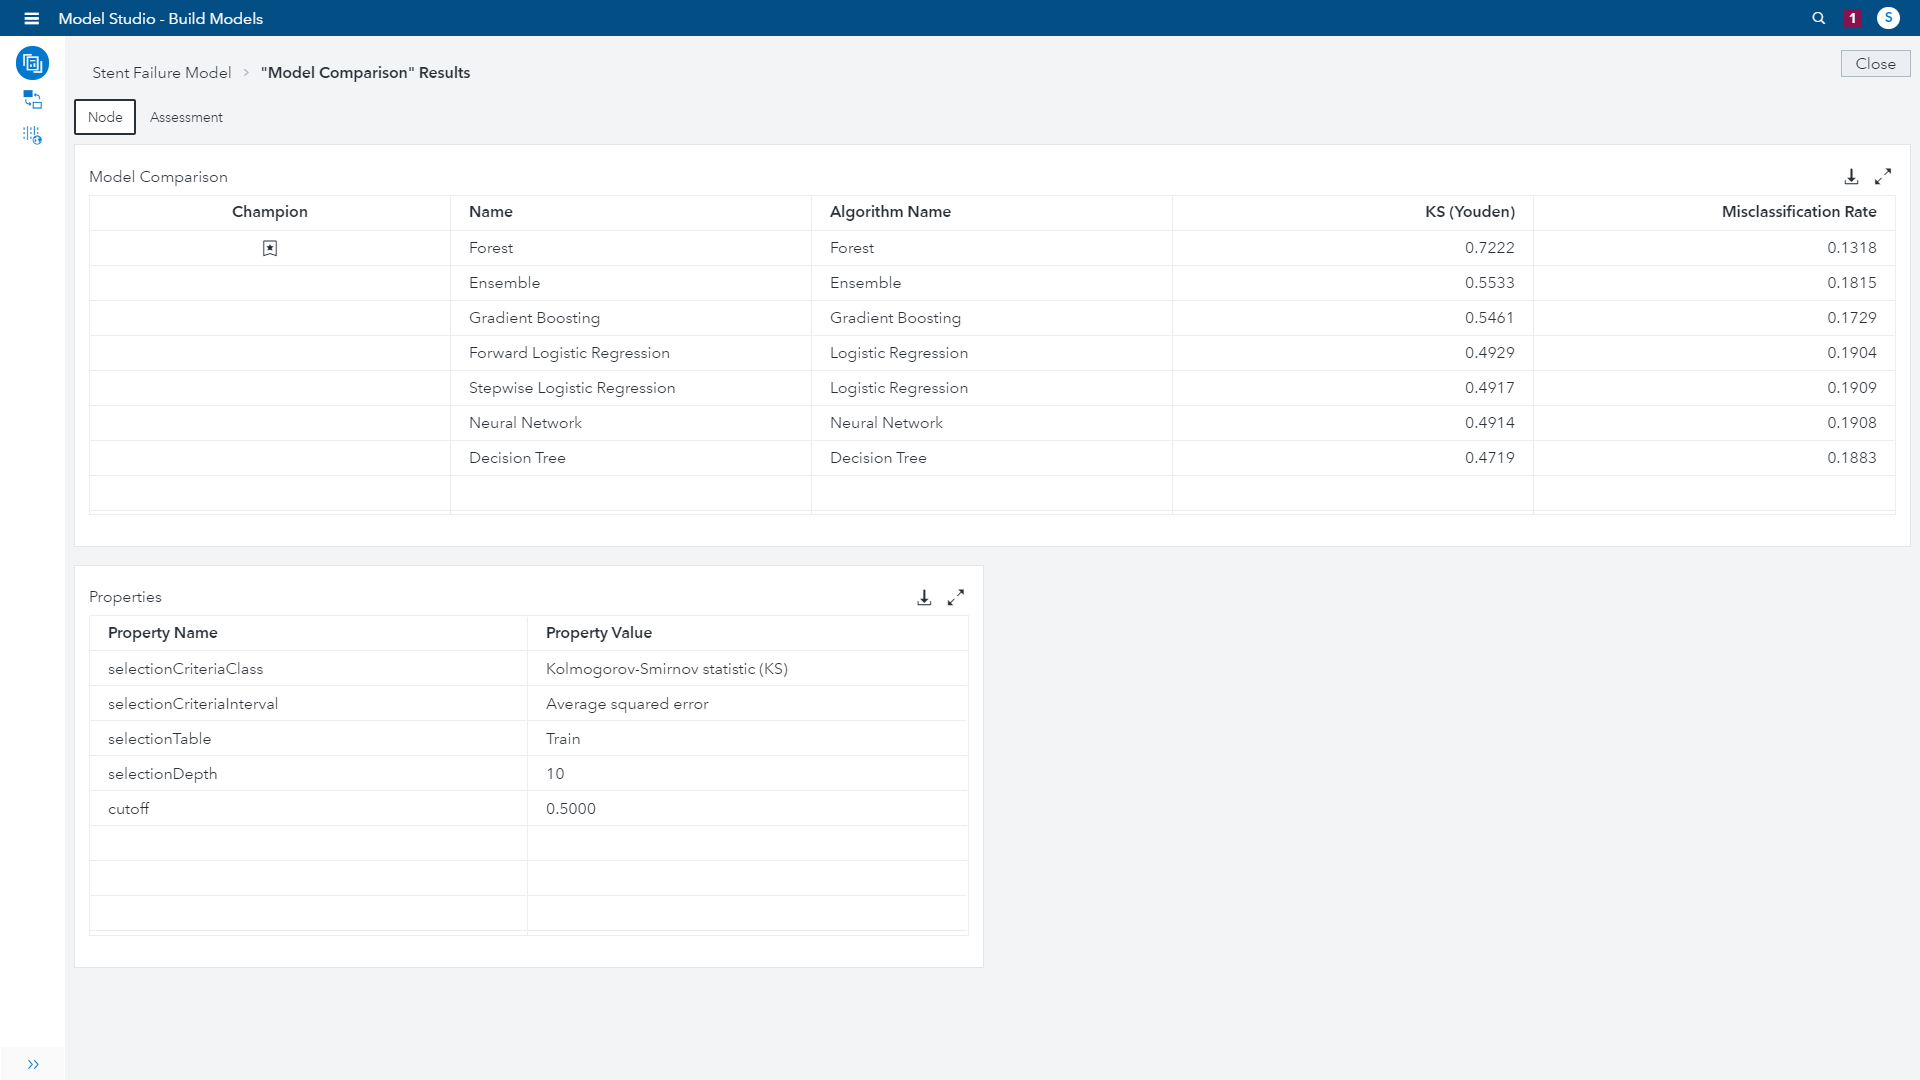
Results of the case study
We added several data mining preprocessors and machine learning techniques that we can then compare to pick the best model. In this case, we can see that the technique with the lowest misclassification rate was the Forest, with 0.1318, after opening the Model Comparison node. We will select this as the champion model. We can further analyse the results in detail, which we will cover in the live meet-the-experts session on July 23.
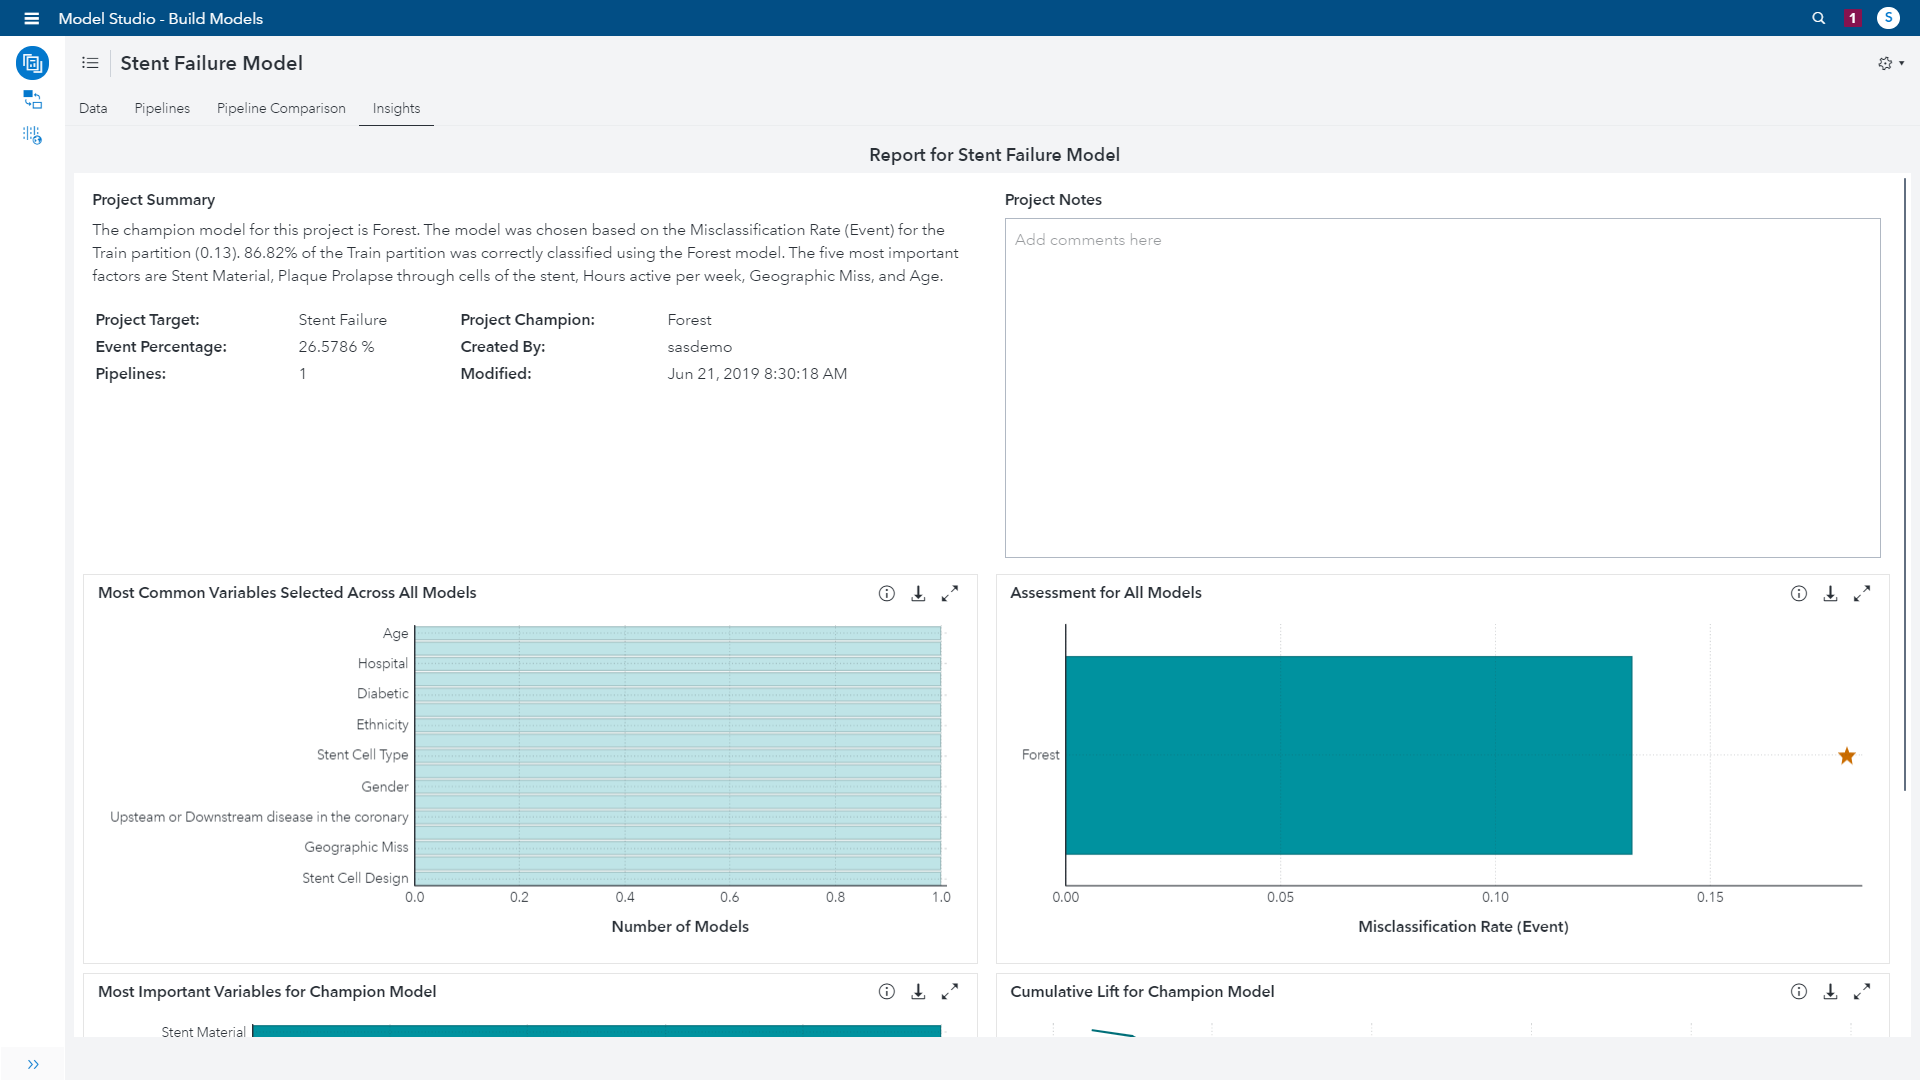
We can select the Insight tab on the top left to get an overview of the result. This gives us a project summary, explains the variable importance and shows project logistics. We created one pipeline in this example. However, in a bigger project, we could have created several pipelines and compared them against each other.
The project summary states, “The champion model for this project is Forest. The model was chosen based on the Misclassification Rate (Event) for the Train partition (0.13). 86.82% of the Train partition was correctly classified using the Forest model. The five most important factors are Stent Material, Plaque Prolapse through cells of the stent, Hours active per week, Geographic Miss, and Age.”
This process used sophisticated machine learning techniques and compared them against each other in a simple, flexible and open interface. For all these reasons, it’s unsurprising to see this product ranked as the standout leader in the Forrester Wave and as a top leader in the Gartner Magic Quadrant.
SAS will host a virtual #Data Science Experience Day on July 23. I look forward to presenting how #machine learning is used to reduce the risk of heart attacks by predicting stent failure. Share on XThe Data Science Experience
On July 23, we are hosting the online SAS Data Science Experience Day. This will be a great opportunity to meet fellow data scientists and network with peers – or if you’re a student aspiring to become a data scientist. The event will be virtual, so you can drop in and out as you wish. It will include learning resources, on-demand videos and LIVE sessions with data scientists who will cover all sorts of AI techniques in different industries. More info here: www.sas.com/datascienceexperience.
A lot of effort has gone into organising this day to ensure it’s as relevant, concise and helpful as possible from real data scientists working on the ground to inspire the next generation. Take a look and register now.

2 Comments
Why does SAS now call methodology such as this AI? Take your stint example, that is a standard prediction problem and the methods you are discussing are not new. I think your platform sounds like it will solve a lot of issues in the analytics life cycle and is powerful and fast, but why are methods that SAS and others have done for years now called AI? What is the working definition of AI at SAS?
Hello Laura,
Thank you for your response.
I'd like to give you our working definition of AI at SAS, which is "The process of training systems to emulate human tasks through
Learning and Automation", this could include understanding context (Text Analysis), learning patterns (Machine Learning) or object detection (Computer Vision) where the machines can learn from experience, adjust to new inputs and accomplish specific tasks without manual intervention.
Within my blog, I mentioned examples where we could apply Text Analytics, Computer Vision, Forecasting in the Health care Industry, as well as my case study which is Machine Learning - we see these as the 4 pillars of AI.
In my case study, we used Machine learning, yes I agree that the algorithms aren't 'new', but Machine Learning in it's essence is the scientific study of algorithms and statistical models that computer systems use in order to perform a specific task effectively without using explicit instructions, relying on patterns and inference instead. This is exactly what was done within my case study - I hope we can agree on that. It is seen as a subset of artificial intelligence.
More than happy to have a more detailed discussion.
Thank you,
Haidar