Get the right information, with visual impact, to the people who need it

Understanding your data: Missing at random versus missing not at random

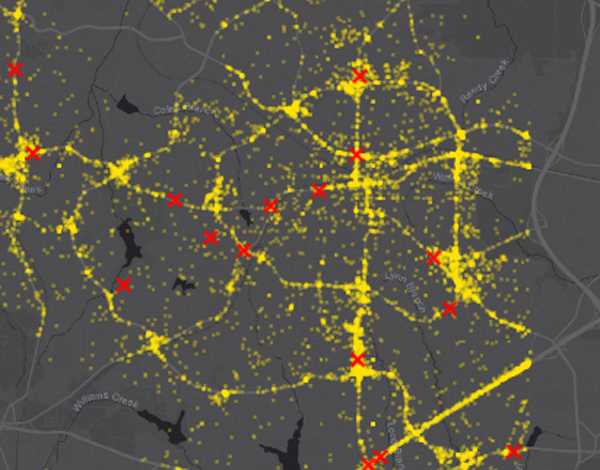
In our last blog we explored the potential impact of missingness in data in terms of its impact on models which require complete case analysis. We took a simple view that data was missing with an equal, independent, probability for any given model input. This week we explore cases where