Recently, I had a discussion with a user concerning the volume of imagemap data generated for an interactive, web-based visual contain a large number of graphs. The large amount of imagemap data was causing problems with the current version of their web browser. The graphs consisted of either bar charts or series plots with bandplots in the background representing different levels. The band levels were computed values, but they were constant across the X variable for each graph. The user noticed that the output contained a large amount of imagemap data for the bandplot, and it appeared to be duplicated information.
The key to understanding this result (and how to prevent it) is to understand the difference between specifying variables for upper and lower limits versus specifying constants. First, let’s create a simple dataset that simulates this situation:
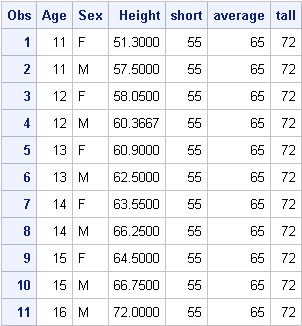
proc summary data=sashelp.class nway; class age sex; var height; output out=meandata mean=; run; /* Add the "computed" band levels */ data meanheight; set meandata; short = 55; average = 65; tall = 72; run; |
The resulting dataset contains 11 observations and appears like the following table :
Given that the limit variables are contained in the dataset, you would naturally use those variables in the BAND statement to draw the levels:
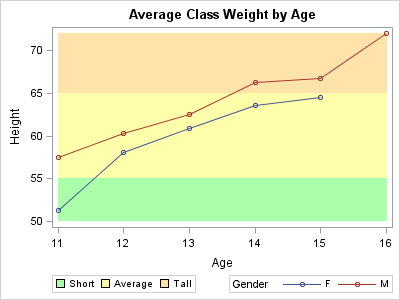
ods html file="average_height.html"; ods graphics / imagemap; Title "Average Class Weight by Age"; proc sgplot data=meanheight; band x=age upper=tall lower=average / name="tall" legendlabel="Tall" fillattrs=(color="light orange") transparency=0.5; band x=age upper=average lower=short / name="average" legendlabel="Average" fillattrs=(color="light yellow") transparency=0.5; band x=age upper=short lower=50 / name="short" legendlabel="Short" fillattrs=(color="light green") transparency=0.5; series x=age y=height / group=sex markers lineattrs=(pattern=solid) name="series"; keylegend "short" "average" "tall" / position=bottomleft; keylegend "series" / position=botomright title="Gender"; run; ods html close; |
The visual looks okay; but, if you look at the imagemap data, there were 10 records generated for each bandplot. The reason is that, when you use variables for the limits, the limit values can change across the X values. Therefore, records must be created for each value of X to guarantee that the correct value appears in the tip. The more X values in your data, the more imagemap records are generated for the bandplot.
However, when the limit values are really constant, you can avoid this situation by extracting the constant values from the dataset and setting them into macro variables:
data _null_; set meanheight; if (_n_ = 1) then do; call symput("TALL", tall); call symput("AVERAGE", average); call symput("SHORT", short); end; run; |
Now, the procedure can be modified to use the constants from the macro variables:
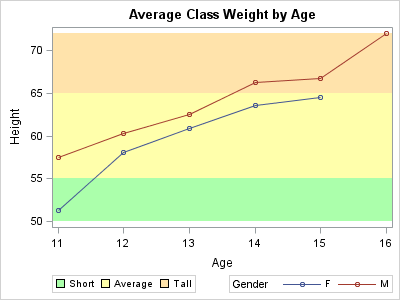
Title "Average Class Weight by Age"; proc sgplot data=meanheight; band x=age upper=&TALL lower=&AVERAGE / name="tall" legendlabel="Tall" fillattrs=(color="light orange") transparency=0.5; band x=age upper=&AVERAGE lower=&SHORT / name="average" legendlabel="Average" fillattrs=(color="light yellow") transparency=0.5; band x=age upper=&SHORT lower=50 / name="short" legendlabel="Short" fillattrs=(color="light green") transparency=0.5; series x=age y=height / group=sex markers lineattrs=(pattern=solid) name="series"; keylegend "short" "average" "tall" / position=bottomleft; keylegend "series" / position=botomright title="Gender"; run; |
The visual looks the same; however, the imagemap for each band contains only 2 records.This is true regardless of the number of X values. For a web output containing a large number of these graphs, the savings in imagemap size can improve the performance of your visual in a web browser.