Most users of the ODS Graphics system have probably had the need to adjust the dimensions of their graph output at times. The ODS GRAPHICS statement makes this easy to do. This statement supports the WIDTH= and HEIGHT= options. If you set just one of these, the system will calculate the other value so as to maintain the same aspect ratio for the graph. You can set both the options to force a specific dimension.
When you change the graph size, the system automatically adjusts the marker and font sizes of your new output. Also tweaked are any gutters, pad values or other ‘gaps’ in the graph. This keeps the contents of your graph in proportion to the output size.
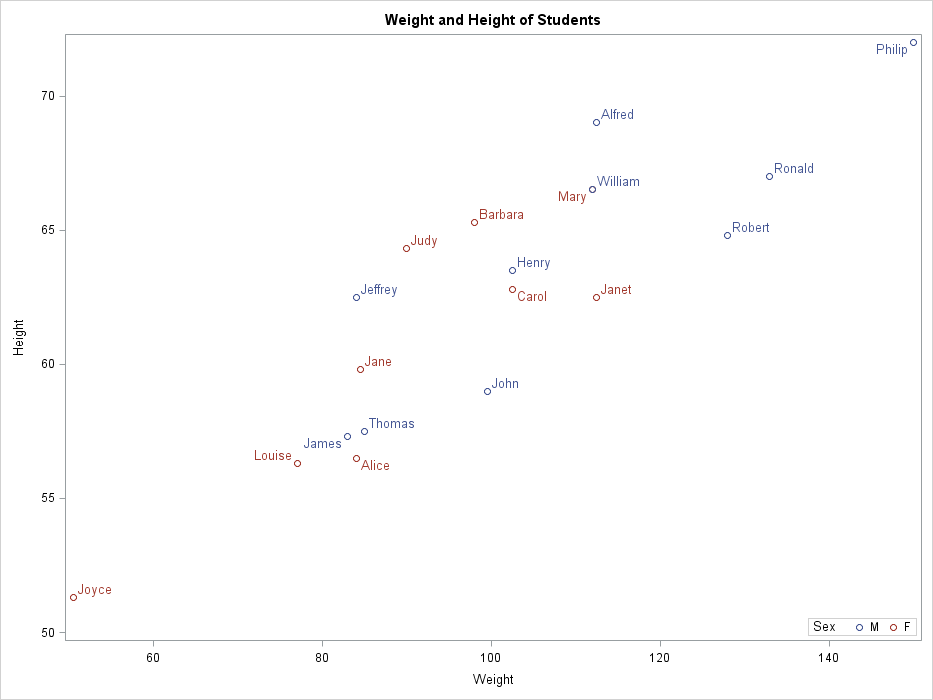
Here is a scatter plot example with data labels turned on:
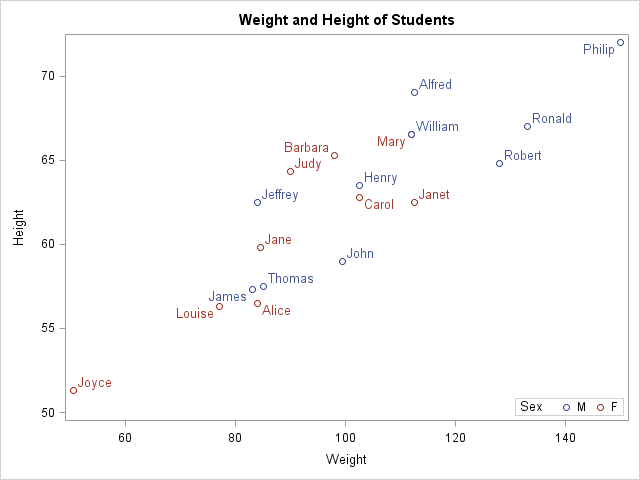
The default height is 480 pixels. Let us say you want a smaller output, 300 pixels high, for a thumbnail image. So we set the HEIGHT= option in the ods graphics statement accordingly:
ods graphics / height=300px;
This output is shown below:
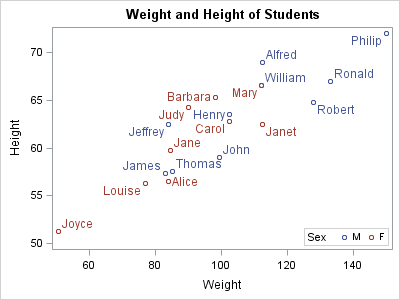
You will notice that the fonts and markers are slightly smaller here. The gap between the discrete legend and the wall border has also been slightly reduced. The ODS Graphics system uses non-linear scaling to adjust the markers, fonts and gaps to retain the same visual feel for their relative sizes. This behavior is controlled by the SCALE= option on the ODS GRAPHICS statement, which is ON by default. So in effect, it is as if you had the following statement in your program:
ods graphics / scale=ON height=300px;
Note that you can also use SCALE and NOSCALE flags to set this option. Setting SCALE to OFF will retain the original size of the contents regardless of the output size. Shown below is the same graph as above, except with the SCALE flag turned off:
ods graphics / scale=OFF height=300px;
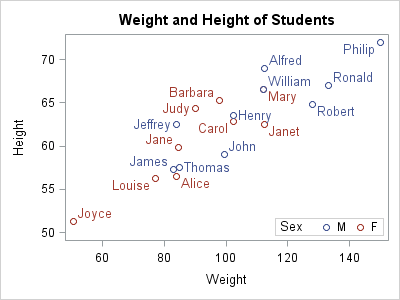
The marker, font and gap sizes in the above output are the same as the default-sized image. When reducing the image size, it is usually best to leave the SCALE option set to ON, unless you are graphing sparse data and there is less likelihood of the markers and labels colliding.
The SCALE option persists for the life-time of the ODS GRAPHICS statement. If you wish to revert to the default you can reset the value as follows:
ods graphics / reset=scale  ; /* Reset only scale */
ods graphics / reset=ALL  ; /* Reset all graphics options */
The scaling feature also comes into play when you increase your output size. Let us now generate a larger output by changing the height to 700 pixels with SCALE option set to ON:
ods graphics / scale=on height=700px;
The output is shown below:
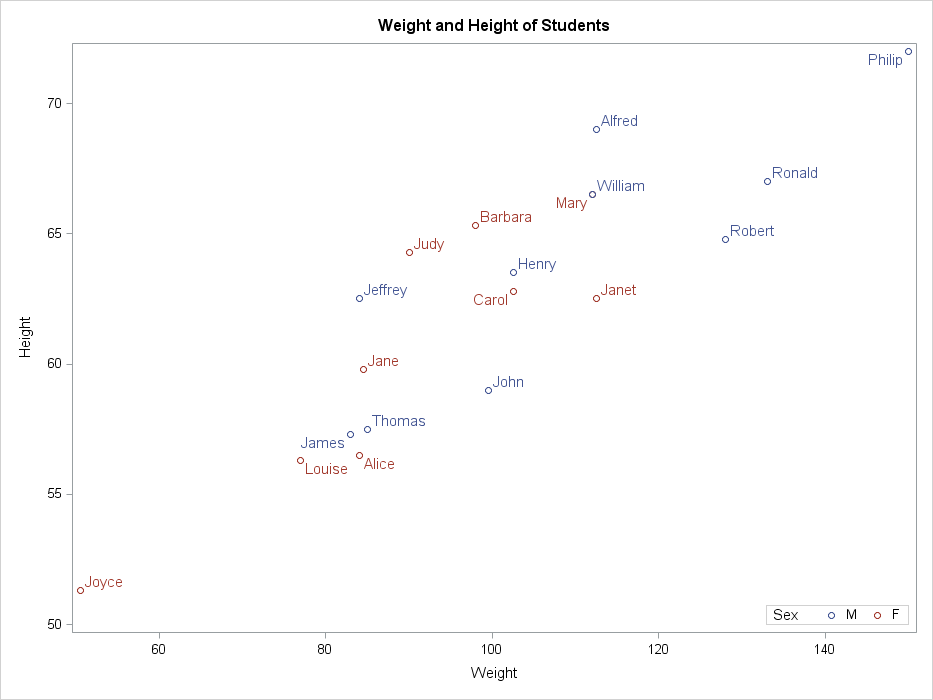
Did you notice the larger font and marker sizes above? The increased gap between the discrete legend and the wall border is also noticeable.
There may be times when you need to increase the white space in your output while retaining the original sizes of the fonts and markers when you increase the output size. You can do that by setting the SCALE to OFF, as we saw earlier. Here is the same sized output with no scaling:
Once again, compare the text, markers and gaps with the previous images. Notice that they have the same size as in the original image of default height.
This option may come in handy the next time you time you want to shrink a plot or you want to enlarge the output and you want the data labels and markers to have more “breathing room”!


5 Comments
For some graphics, it is important to set the aspect ratio of the graph to 1, so that the distance along the X and Y axes are compatible. Currently I "eyeball" it and use
ODS graphics / width=w height=h;to get a graph for which the X and Y scales are approimately equal. I can't compute exact values for w and h because I don't know the values for various margins/gutters/pad values. (Also, screen pixels aren't square.) Any hints on creating a graph where the X and Y scales are approximately equal?
If you are interested in equal "data to screen", or rendering scale for the lack of a better term, I'd suggest a look at LAYOUT OVERLAYEQUATED. Will that help?
We also support ASPECTRATIO= on overlay and prototype layouts, but that specifically controls the aspect of the wall and not necessarily the data to screen scale.
Please have more articles on using the ODS graphics statement and simple uses of Proc Template. I need to make high quality charts for journal articles and PowerPoint slides but it is not clear how to change font sizes, fonts, and get better quality rendering on a monitor and for printing. The official documentation is rather dense. Specific examples help a lot!
Thanks
Thank you for your suggestion. As a general rule, increasing the dpi for your output gives you better results. Try setting the IMAGE_DPI=300 on your ods listing or html destination. Sanjay has provided more details on this in response to your question on his Graphs with Class article
Also note that we have a user guide for GTL in addition to the GTL language reference. You can find the user guide for SAS 9.3 here. Please navigate down to the section on "Managing Graphical Output" for information on other ODS GRAPHICS Statement options.
Lastly, in some future release, ODS may support a PowerPoint destination as well.
Pingback: High quality graphs - Graphically Speaking