In the previous post, “Roses are red, violets are blue…”, I discussed the general problem of getting style attributes to line up with specific group values and some ways to overcome the problem. In this installment, I want to elaborate on the attribute map functionality in the Graph Template Language (GTL) that I mentioned at the end of the last post.
As I mentioned previously, attribute maps in the SG procedures are defined in datasets while, in GTL, they are coded directly in the template. To see how this code works in GTL, let’s convert a previous SG example into GTL and see how the attribute map connects to the plot.
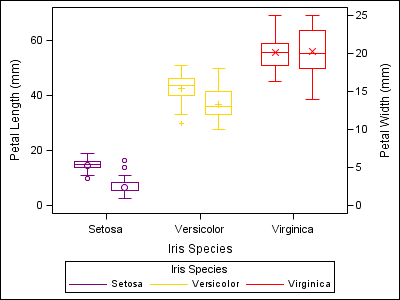
proc template; define statgraph boxplot; begingraph; DiscreteAttrMap name="__ATTRMAP__"; Value "Setosa" / markerattrs=( color=CX800080 symbol=circle) lineattrs=( color=CX800080 pattern=solid); Value "Versicolor" / markerattrs=( color=CXFFD700 symbol=plus) lineattrs=( color=CXFFD700 pattern=solid); Value "Virginica" / markerattrs=( color=CXFF0000 symbol=x) lineattrs=( color=CXFF0000 pattern=solid); EndDiscreteAttrMap; DiscreteAttrVar attrvar=MYID_SPECIES var=SPECIES attrmap="__ATTRMAP__"; layout overlay / yaxisopts=( type=linear linearopts=( viewmin=0 ) ) y2axisopts=( type=linear linearopts=( viewmin=0 ) ); BoxPlot X=Species Y=PetalLength / discreteOffset=-0.2 Group=MYID_SPECIES boxWidth=0.4 NAME="VBOX" display=( caps mean median outliers) groupdisplay=cluster; BoxPlot X=Species Y=PetalWidth / discreteOffset=0.2 yaxis=y2 Group=MYID_SPECIES boxWidth=0.4 NAME="VBOX1" display=( caps mean median outliers) groupdisplay=cluster; DiscreteLegend "VBOX"/ title="Iris Species"; endlayout; endgraph; end; run; proc sgrender data=sashelp.iris template=boxplot; run; |
The DISCRETEATTRMAP block defines the associations between discrete group values and visual attributes. The attributes are defined using the standard GTL attribute bundle syntax. The DISCRETEATTRVAR statement is the “glue” to bind the attribute map to a variable. The data variable is specified on the VAR option and the new attribute variable ( MYID_SPECIES) is specified on the ATTRVAR option. This ATTRVAR is used on the GROUP option for both box plots. If the SPECIES variable was used on the GROUP option instead of MYID_SPECIES, the boxes would have been drawn without using the visual attributes from the attributes map.
Discrete attribute maps can also be directly associated with discrete legends. This is a great way to create uniform legends with all possible values that could appear across BY-groups. In this example, I remove the one iris variety by using a WHERE clause; but, because the attribute map is associated with the legend, all three values appear.
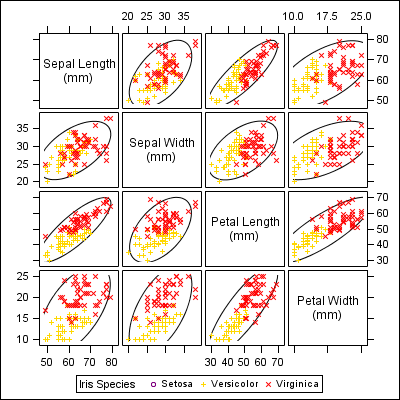
proc template; define statgraph matrix; begingraph / designwidth=640 designheight=640; DiscreteAttrMap name="__ATTRMAP__"; Value "Setosa" / markerattrs=( color=CX800080 symbol=circle) lineattrs=( color=CX800080 pattern=solid); Value "Versicolor" / markerattrs=( color=CXFFD700 symbol=plus) lineattrs=( color=CXFFD700 pattern=solid); Value "Virginica" / markerattrs=( color=CXFF0000 symbol=x) lineattrs=( color=CXFF0000 pattern=solid); EndDiscreteAttrMap; DiscreteAttrVar attrvar=MYID_SPECIES var=SPECIES attrmap="__ATTRMAP__"; layout gridded; layout lattice; ScatterPlotMatrix SepalLength SepalWidth PetalLength PetalWidth / NAME="MATRIX" Group=MYID_SPECIES Ellipse=( Type=Predicted); endlayout; DiscreteLegend "__ATTRMAP__" / type=marker order=rowmajor title="Iris Species"; endlayout; endgraph; end; run; proc sgrender data=sashelp.iris template=matrix; where species ne "Setosa"; run; |
One important item to notice in this example is the TYPE option on the discrete legend. This option is required in this case because the legend does not have enough context to know which type of legend value to display. With TYPE=MARKER specified, the legend knows to display a scatter marker using the marker attributes from the attribute map.
Attribute maps can also be defined for continuous classifier variables. The range attribute map can be used to assign a single color to a numeric range or even a gradient ramp within the range. In the following example, a color is assigned to each range of petal width.
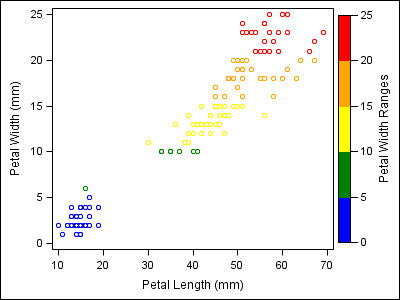
proc template; define statgraph petal; begingraph; RangeAttrMap name="__ATTRMAP__"; range 0-5 / rangecolor=blue; range 5-10 / rangecolor=green; range 10-15 / rangecolor=yellow; range 15-20 / rangecolor=orange; range 20-25 / rangecolor=red; EndRangeAttrMap; RangeAttrVar attrvar=MYID_WIDTH var=PetalWidth attrmap="__ATTRMAP__"; layout overlay; ScatterPlot X=PetalLength Y=PetalWidth / primary=true NAME="SCATTER" markercolorgradient=MYID_WIDTH; ContinuousLegend "SCATTER"/ title="Petal Width Ranges"; endlayout; endgraph; end; run; proc sgrender data=sashelp.iris template=petal; run; |
Another variation on this example shows how you can use a gradient function to calculate a gradient between two colors and assign a single color from that ramp to a range. This function can make it much easier to determine ramp colors across a set of ranges.
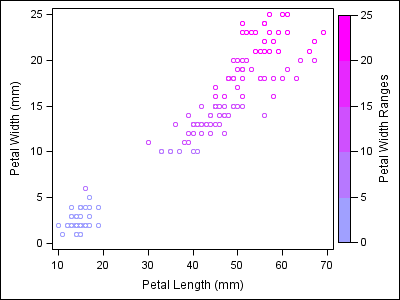
proc template; define statgraph petal; begingraph; RangeAttrMap name="__ATTRMAP__"; range 0-5 / rangecolor=gradientstepper(cxA0A0FF, cxFF00FF, 5, 1); range 5-10 / rangecolor=gradientstepper(cxA0A0FF, cxFF00FF, 5, 2); range 10-15 / rangecolor=gradientstepper(cxA0A0FF, cxFF00FF, 5, 3); range 15-20 / rangecolor=gradientstepper(cxA0A0FF, cxFF00FF, 5, 4); range 20-25 / rangecolor=gradientstepper(cxA0A0FF, cxFF00FF, 5, 5); EndRangeAttrMap; RangeAttrVar attrvar=MYID_WIDTH var=PetalWidth attrmap="__ATTRMAP__"; layout overlay; ScatterPlot X=PetalLength Y=PetalWidth / primary=true NAME="SCATTER" markercolorgradient=MYID_WIDTH; ContinuousLegend "SCATTER"/ title="Petal Width Ranges"; endlayout; endgraph; end; run; proc sgrender data=sashelp.iris template=petal; run; |
The first two arguments to the gradient function are the start and end colors for the ramp. The third argument specifies how many color steps to calculate. The last argument specifies which color step to return.
The attribute map support in the SG procedures can handle a lot of the common cases that you may encounter. But, if you need more advanced features, the discrete and range attribute map support in GTL could be the best choice. Be sure to see the documentation for more features not shown in the examples above.


5 Comments
The method you described in the last post seems so much easier. Why would someone ever want to use this method instead?
I mentioned two methods in the previous post, so I'm not sure which of the two you consider easier. Therefore, I'll summarize the pros and cons for both. For the INDEX option, it works at SAS 9.2, whereas the attribute map functionality was not introduced until SAS 9.3. So, for those with 9.2, this is really the only option to guarantee alignment. For programs created in 9.3, indexing is really not the best option because it requires you to increase the size of your data, whereas the attribute map defines the association of the style attributes external to the data. Also, indexing does not directly give you the ability to set the attributes. You would have to create a small custom ODS style in which to index to do the attribute assignment. With attribute maps, attribute assignment is staightforward.
As for using GTL attribute maps versus attribute map data sets with the SG procedures, it boils down to the complexity of the graph you are creating. There are times when the graph you are creating cannot be done in the SG procedures and you need to use GTL. This post just showed how you can use attribute maps in GTL when that case arises. Also, GTL supports range attribute maps for continuous classifiers, which is not currently supported in the SG procedures.
Does this answer your question?
Dan;
IS there anything remotely similar to these capabilities in SAS 9.2? I like using the SG template, but attempting to control the markercharacterattrs colors as desired in a group functionality has been a no-go.
Thanks
Lawrence
I am attempting to plot both interval and point data. I want the interval data to be joint by id and the point data to appear in the background.
Please help
Do you mean "physically" joined (as in a series plot) or joined by common attributes?