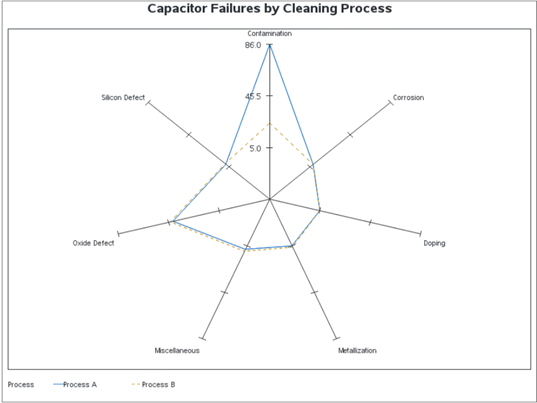
How to draw a radar chart in SAS® Visual Analytics using a custom graph – Part I

In the first of a two-part series, SAS' Cindy Wang shows you how to create a radar chart in SAS Visual Analytics using custom graph capabilities.