In SAS Visual Analytics 7.3, the usage reports accessed from the administrator includes a relationship report. This report provides very basic lineage and dependency information for selected object types. The data to populate this report comes from the middle-tier relationship service. Once you enable the collection and extraction of this data, the data gets autoloaded to the default LASR Analytics Server by the same autoload process that loads the audit data.
If you are not already familiar with the autoload process for the audit report, you can also view my YouTube video here on the same subject.
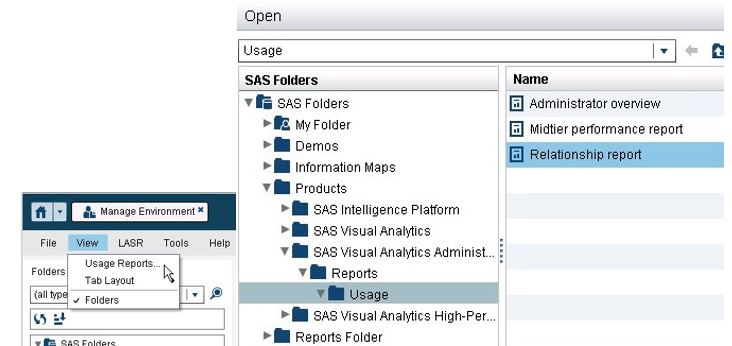
When you access the Usage Reports from the administrator, you will see that that a Relationship report now appears in the Usage folder.
To enable the Relationship report for viewing, in addition to having the autoload process scheduled and running, in SAS Management console, you must also access Application Management–>Configuration Manager–>SAS Application Infrastructure–>Web Infra Platform Services 9.4–>RelationshipContentService properties and make sure that Scheduling for Load Task Enabled is set to true on the Settings tab. This will enable the scheduled collection of relationship data. To enable the periodic extraction of the data, in SAS Management console, access Application Management–>Configuration Manager–>SAS Application Infrastructure–>Visual Analytics 7.3 and set the va.extractRelationshipData Advanced property to true.
To put these property settings into effect, you must restart the SAS Web Application Server.
The first scheduled run of the data load should occur shortly after the server restarts. The task runs every three hours. After the load task runs, you will see both relationships_visualanalytics.csv and relationships_visualanalytics.sas7bdat in the EVDMLA directory under config/Lev1/AppData/SASVisualAnalytics/VisualAnalyticsAdministrator/AutoLoad.
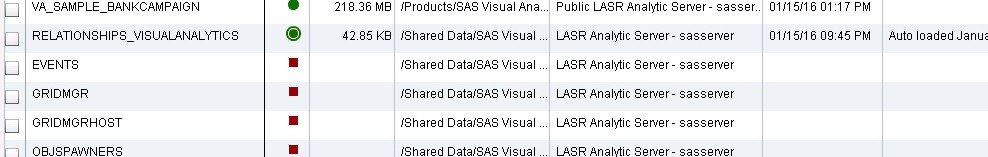
When the Visual Analytics autoload process has run, you should see the RELATIONSHIPS_VISUALANALYTICS table loaded to the LASR Analytic Server:
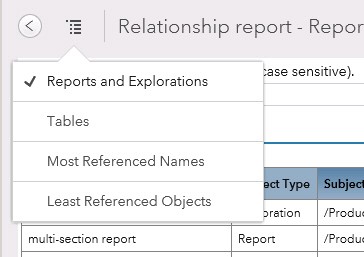
The first report that displays is the list of Reports and Explorations, but you can click the icon to select Tables, Most References Names, or Least Referenced Objects.
Clicking on a report object displays the related objects:
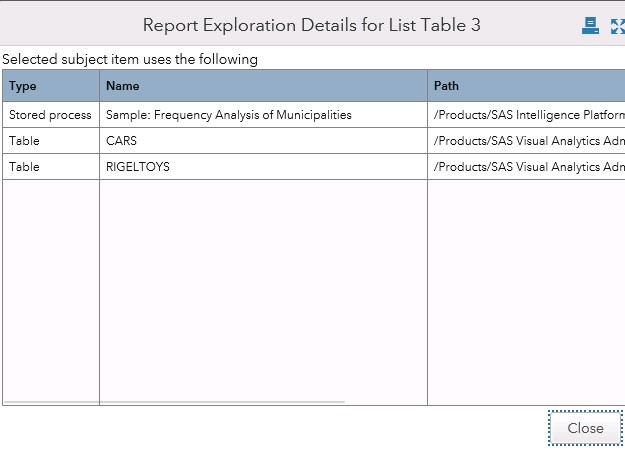
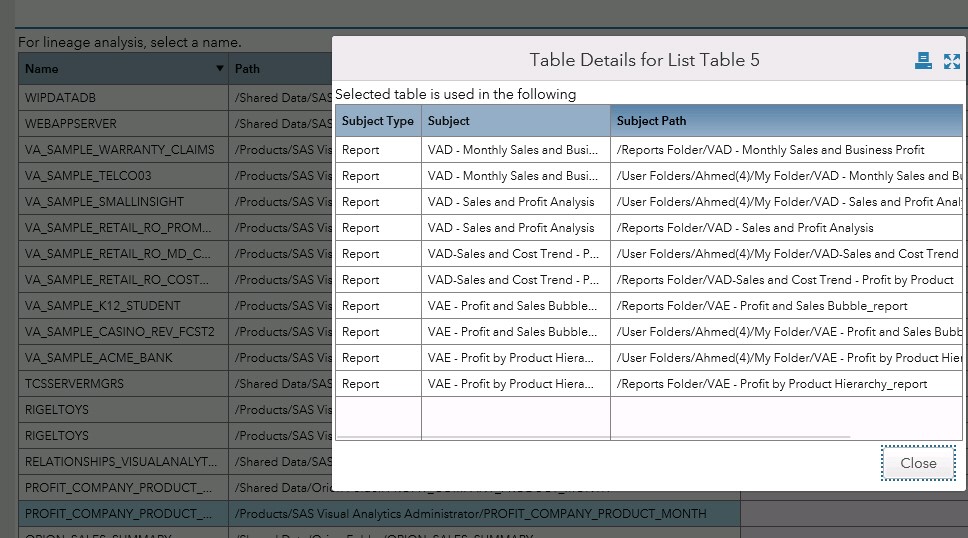
You can access the Tables report and click on a table to display all objects that have a dependency on the selected table.
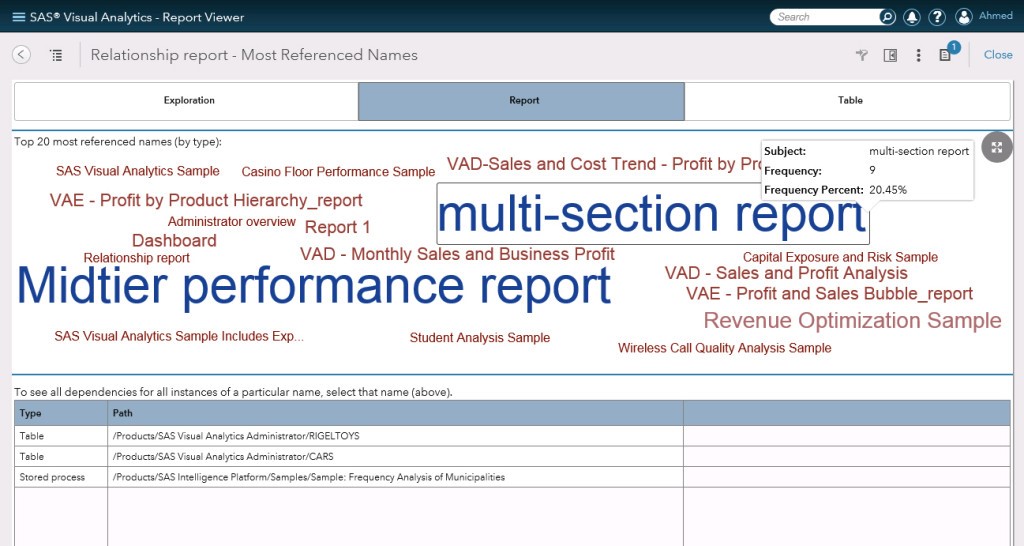
Accessing the Most Referenced Names report and selecting the Report button displays a word cloud, enabling you to click on a report name to display the dependencies for the report name. The 20 most referenced objects of each type is displayed.
Accessing the Least Referenced Objects report displays the least referenced objects, along with the percent associated with their access frequency.
As I said earlier, these supplied reports provide very basic lineage information. See the blog here written by my colleague, Gerry Nelson, to see how to use the batch relationship reporting tools for more detailed relationship reporting.

1 Comment
What's up, this weekend is good in favor of me, as this time i am reading this enormous educational article
here at my home.