 In this post, I continue the journey of getting data profiling results into SAS Visual Analytics. In my first blog I described the process of collecting DataFlux Data Quality profiling metrics to load a datamart. Now we load this datamart into memory (LASR) and then plug a VA report on top to share data quality results widely and wisely.
Overall Process
The process is a 2-step process.
1. Extract data from DataFlux repository and build a DQ profiling datamart (discussed in blog 1)
2. Load the DQ profiling datamart into memory and plug VA reports on it
Here is the master DataFlux Process Job (called _loadProfilingInVA) that orchestrates the 2 steps.
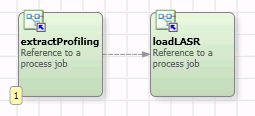
The DQ profiling datamart is made of five tables which are SAS data sets. The goal is to load them into LASR. As we did the first step using a DataFlux process job, we will use another process job to do this step and to have a consistent process that we could orchestrate in a master DataFlux process job, seen above.
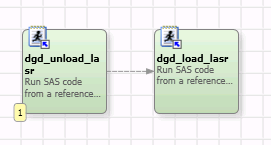
Loading data into LASR is very simple, especially if we assume that those tables have been loaded the first time manually in SAS Visual Analytics Administrator, in order to create all the necessary metadata (tables, jobs, etc.). If this is not the case, it’s not a big deal to do it automatically using proc METALIB. Once this initial step is done, we just want to refresh these tables in memory each time we have new data profiling results to share. That means, we have to unload old data from memory and then load new data in memory.
Even if we want to do that in DataFlux Data Management Studio, we require a SAS engine somewhere to execute SAS statements. DataFlux DMS does not provide nodes to load data directly in LASR. But it provides nodes (available in process jobs, not in data jobs) to execute SAS code against an existing SAS Workspace Server.
My technical environment is quite simple: everything on the same box: DataFlux Data Management Studio, LASR, VA, SAS Workspace Server, DQ profiling datamart SAS data sets, etc. No risk! But, in many SAS environments, it may not be as simple. The following questions might arise:
- Where are my DQ profiling datamart SAS data sets? They are on the same box as DataFlux Data Management Studio/Server, which is probably not the same box as the SAS Workspace Server.
- Is my SAS Workspace Server able to read those remote tables? Probably a data transfer is needed.
- Is my SAS Workspace Server able to load data into LASR? I know there are limitations when the SAS Workspace Server is not located in the same box as the LASR master node but I won’t go into details, some resources are already available to deal with this.
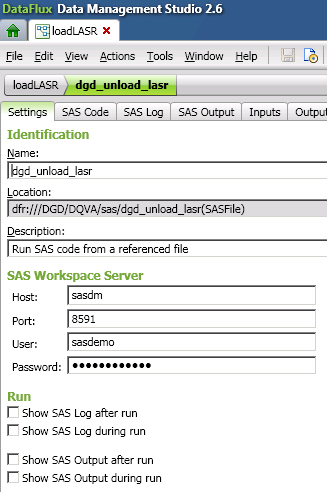
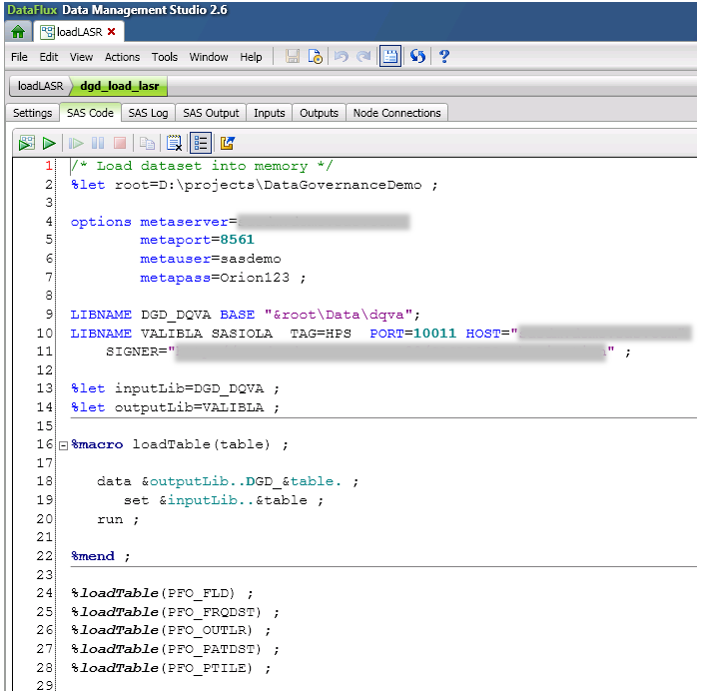
Back to my basic mono-box configuration. Here is an example of how to setup the SAS Workspace Server to be called from DataFlux Data Management Studio/Server:
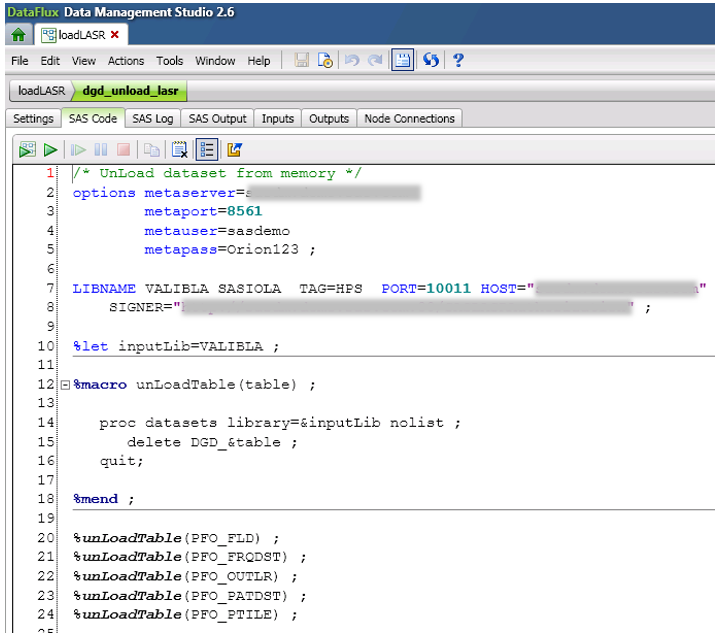
Here is the SAS code to unload data from memory:
And here is the code to load data into memory:
Now, I’m done with the data preparation phase. I’ve executed my master DataFlux Process Job (called _loadProfilingInVA) which:
- Extracts data profiling results from the DataFlux repository
- Creates a set of 5 output tables
- Unloads the 5 old tables from LASR
- Reloads the 5 new tables into LASR
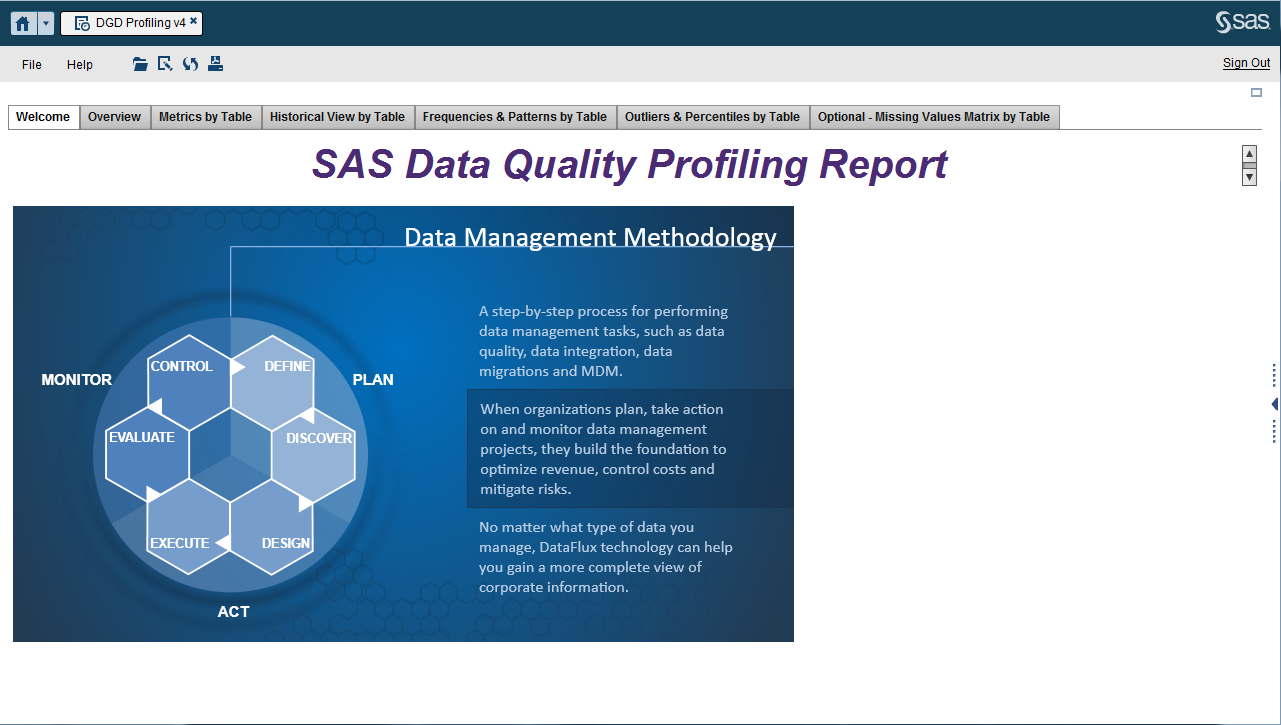
I’m ready for the reporting phase, and I have prepared a VA report with multiples sections that leverage this DQ profiling datamart. Let’s have a look to what it looks like:
An amazing welcome screen
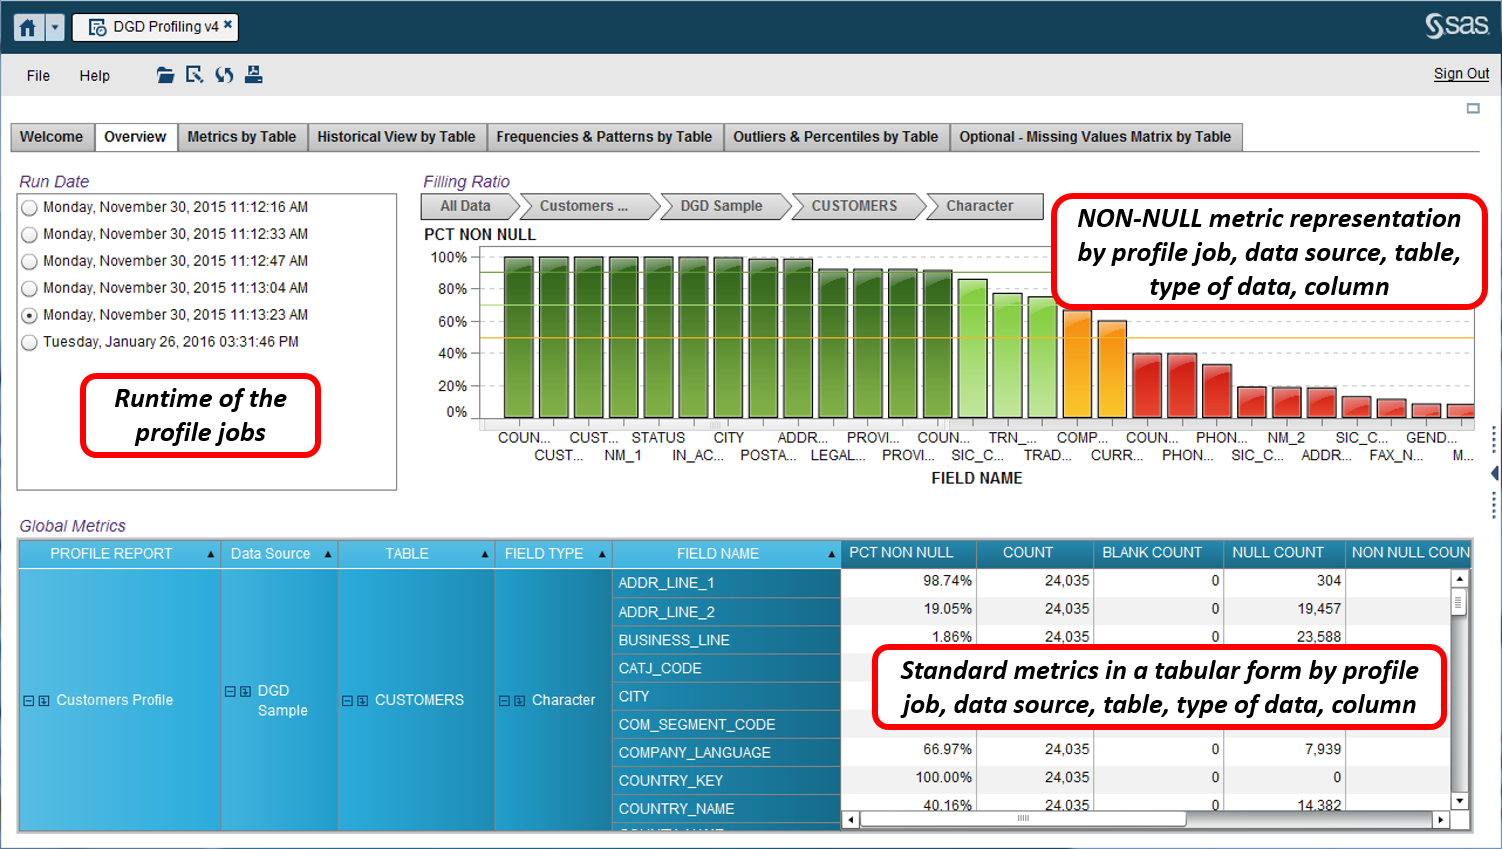
An overview of all the profiling metrics from all the profile jobs runs
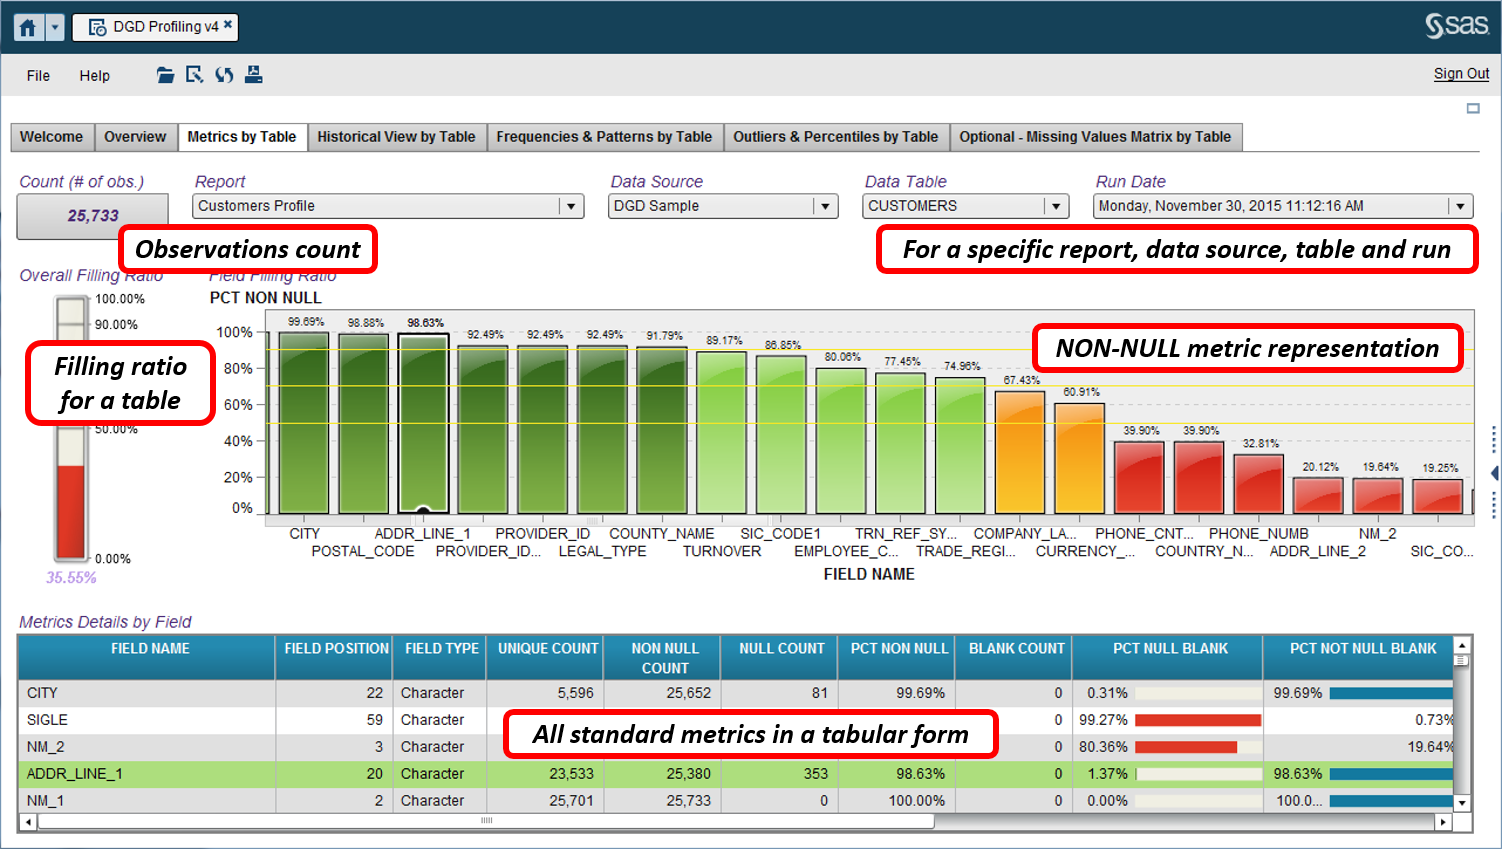
Details of profiling metrics by table for a specific run
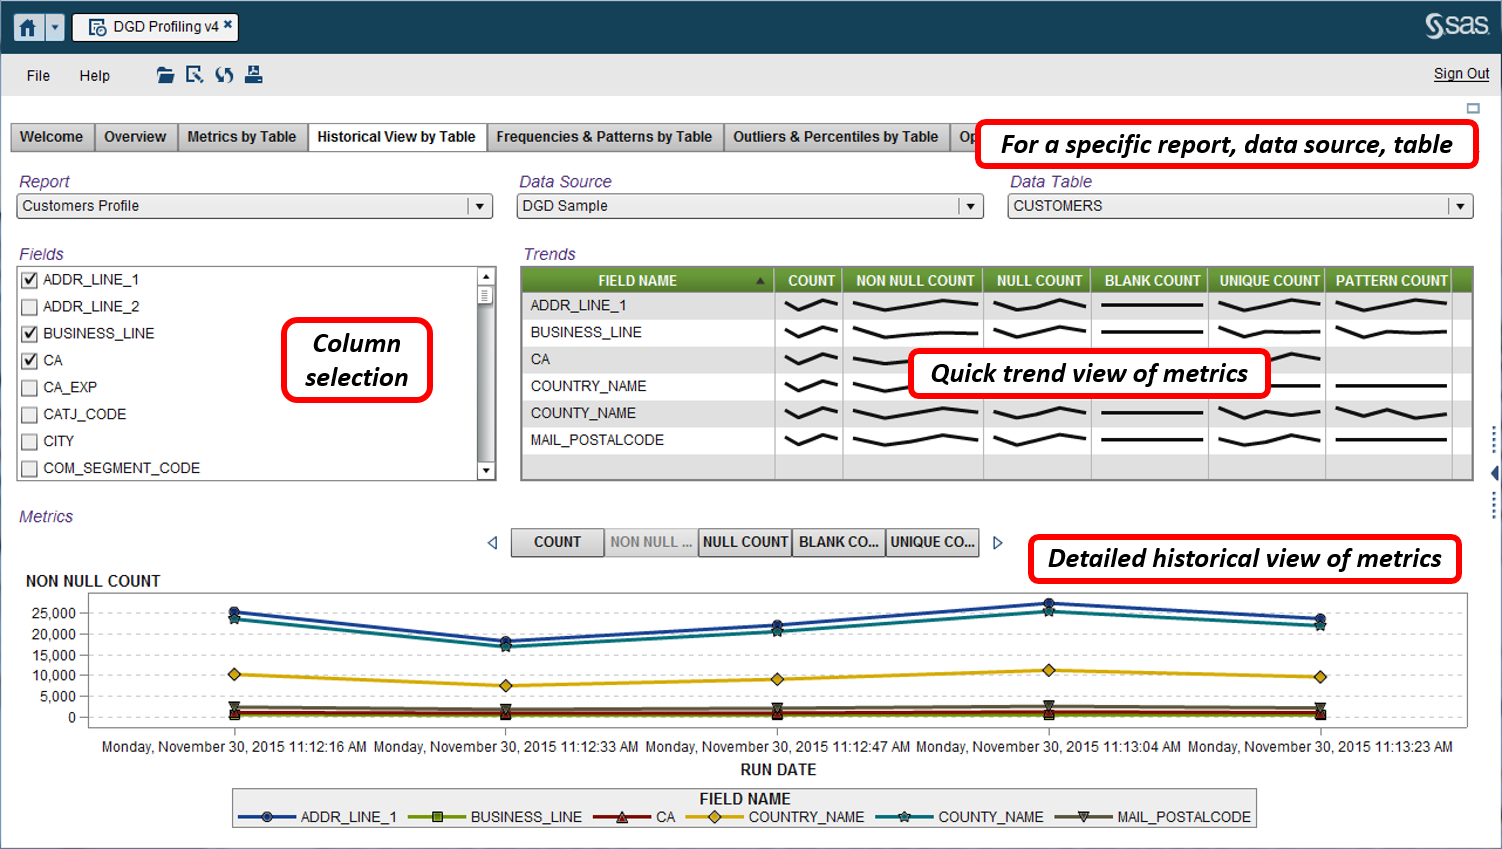
An historical view of profiling metrics
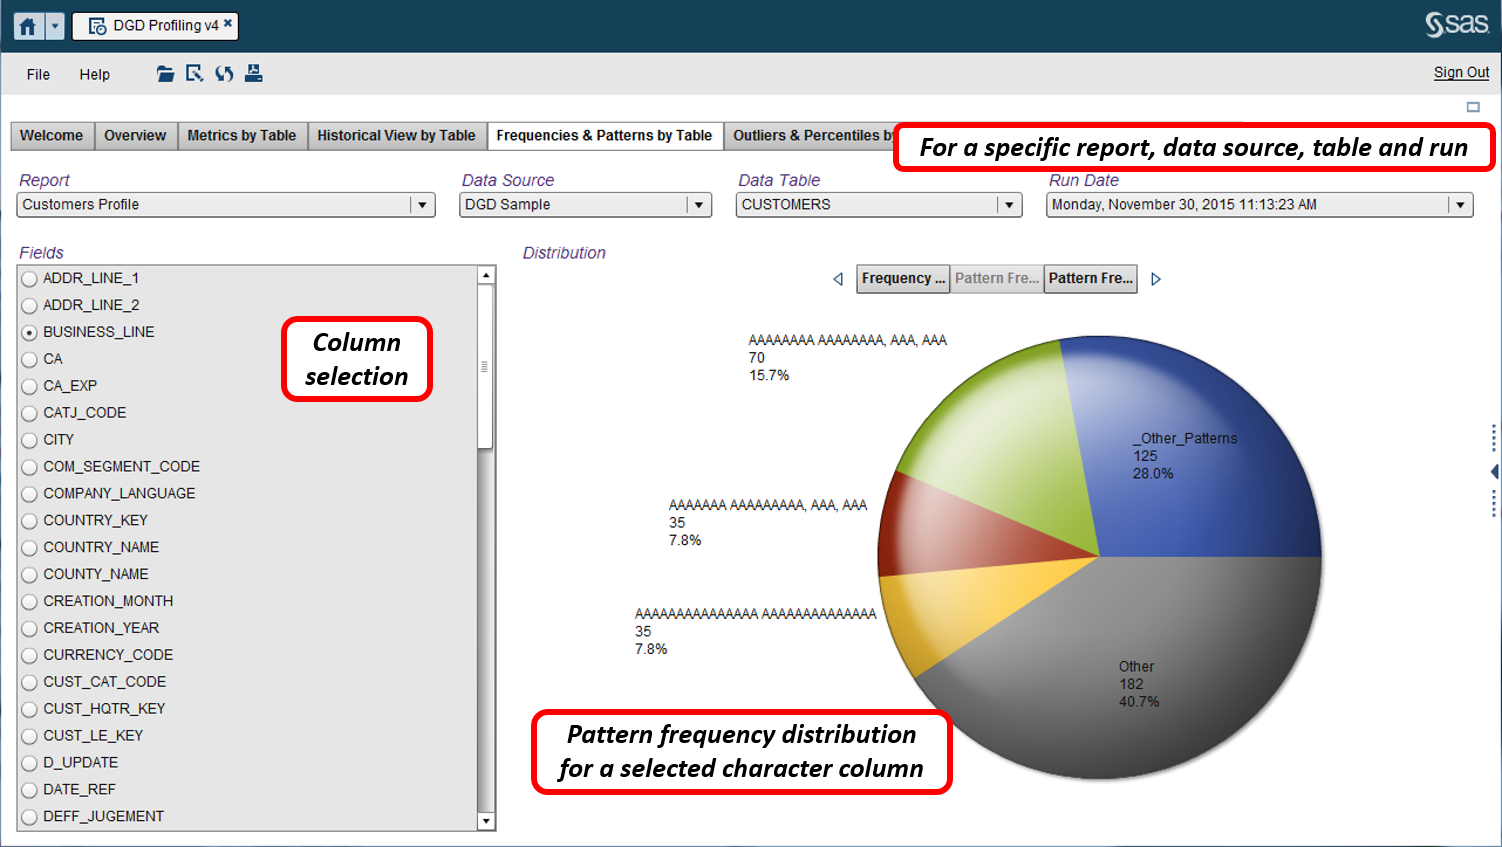
A view of value and pattern frequency distribution
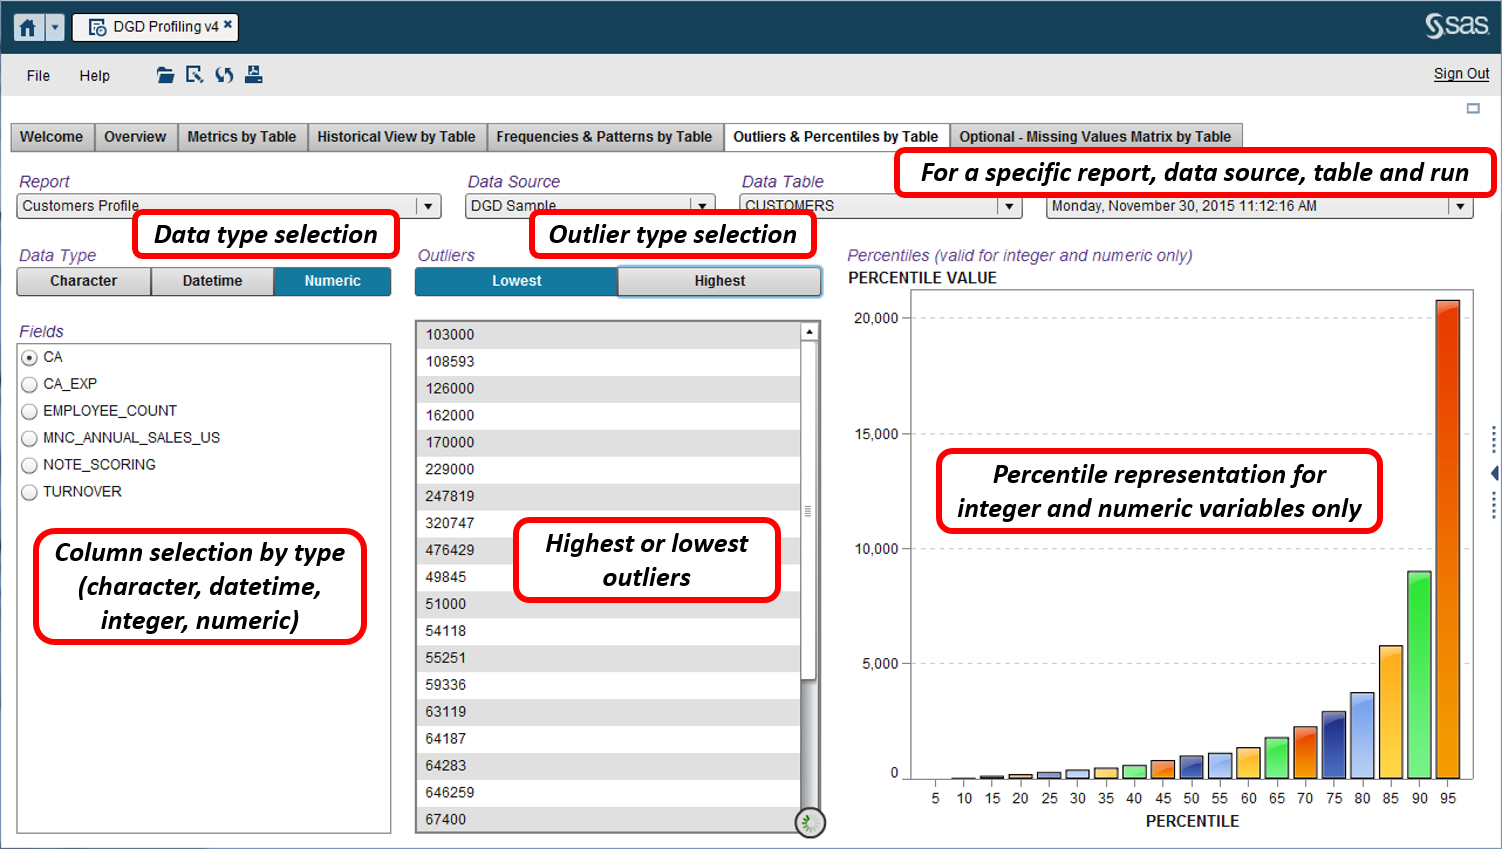
A view of outliers and percentiles

2 Comments
This is amazing. And very well defined.
Thanks Nicolas for your comprehensive details ..It was really useful material.