 This is my first blog post, and the first of a long series around Data Governance. The first thing I want to discuss is the ability to Share DataFlux Data Quality profiling metrics in SAS Visual Analytics.
This post will illustrate how to extract profiling data from the DataFlux repository and how to use SAS Visual Analytics to distribute profiling results centrally and widely through an organization.
To enable data profiling visualization in SAS Visual Analytics, you need to have SAS Visual Analytics, either the full version in addition to any solution containing DataFlux Data Management Studio or Server, or the VAAR (Visual Analytics Administration & Reporting) component that is included, for example, in SAS Data Governance, SAS Data Quality Advanced, SAS Data Management Advanced and SAS MDM Advanced.
Overall process
The process is a 2-step process:
- Extract data from DataFlux repository and build a data quality profiling datamart
Load the data quality profiling datamart into memory and plug VA reports on it
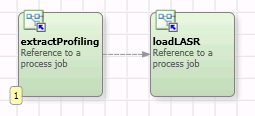
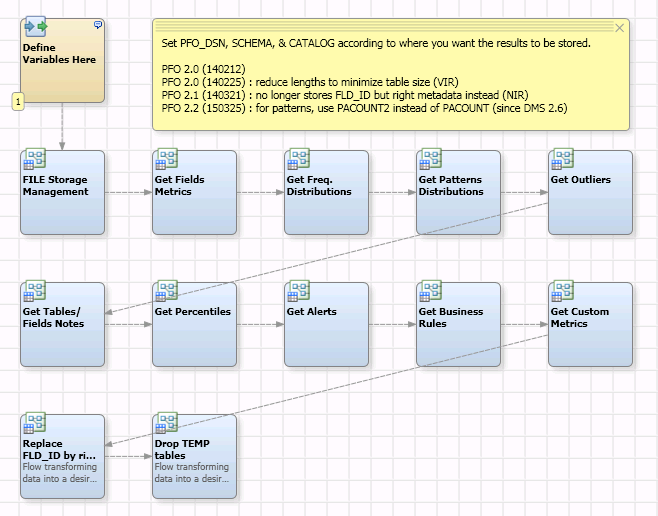
Here is the master DataFlux Process Job that orchestrates the 2 steps.
So, let’s start. The first thing to do is to export data profiling results from the DataFlux repository to a set of tables that will be the base of our reports. SAS Data Management Studio does not provide special nodes to query easily the repository for profiling results, as it does for monitoring results. In this case, we will use SQL queries to extract required data to build the necessary reports.
Repository Data Model
To go further, we need to know a bit more about the DataFlux Repository physical data model. There are (at least) two ways to describe it:
First way (preferred): in the Data Management Studio Options window (Tools -> Data Management Studio Options -> General -> Save Repository Schema…)
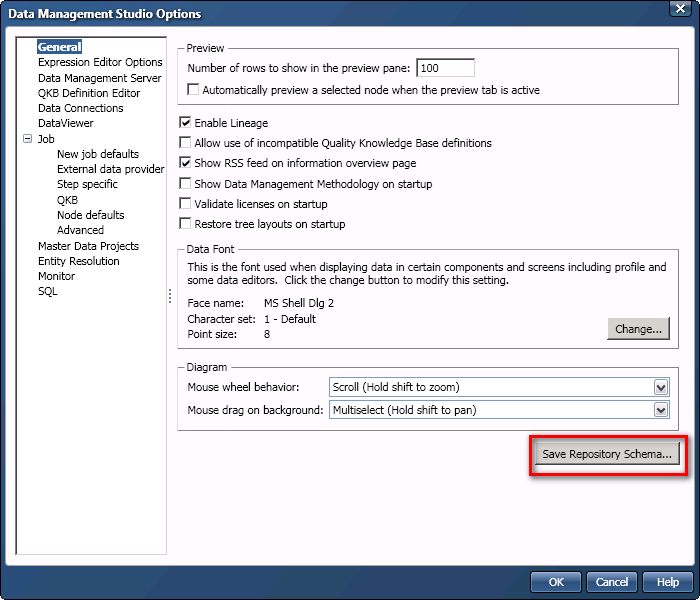
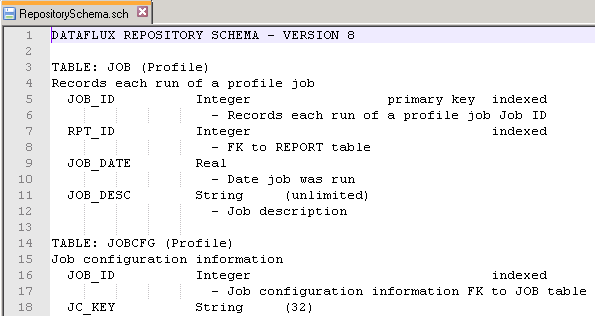
The resulting file is a very useful text file that describes all repository profile and monitor tables, and their relations.
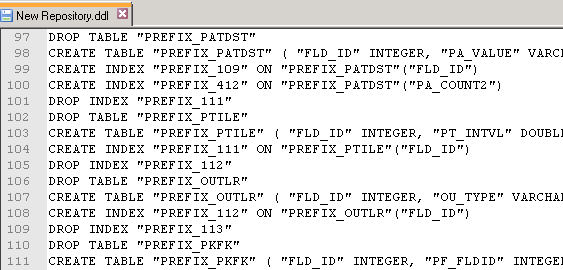
Second way (more technical): in the Data Management Studio New Repository Definition window (Administration -> Repository Definitions -> New Repository Definition… -> Database Connection -> Save Repository DDL…)
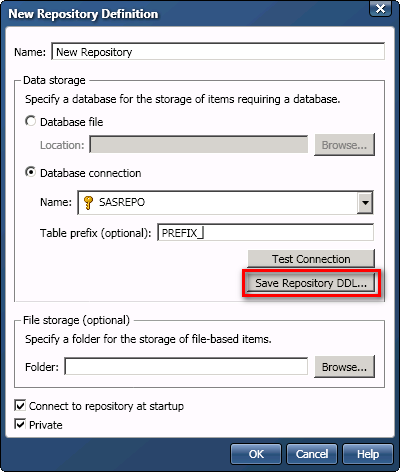
NB: you can cancel the creation of the repository once you get your DDL file.
The resulting file is an SQL script enabling the creation of the repository by an admin directly in the target DBMS. It describes all the repository tables but might be hard to read.
Now that you know more about how to go further with the repository data model, we can move to the data quality profiling datamart build.
1 – Extract data from DataFlux repository and build a data quality profiling datamart
This phase is done using a DataFlux Process Job that combines multiples DataFlux Data Jobs. Here are the steps:
- Get common information and field metrics from a join between the following repository tables:
- DSN (Records each ODBC DSN in the job),
- FLD (Records metrics for each field in a table),
- TBL (Records each table that is processed),
- JOB (Records each run of a profile job),
- REPORT (Records Profile reports),
- JSETUP (Job setup root table)
- Get frequency distributions from a dynamic select of FRQDST<xxx> (Frequency distribution tables; 1 table per field per execution)
- Get pattern distributions from PATDST (Pattern frequency distribution)
- Get outliers from OUTLR (Min/Max Outliers)
- Get percentiles from PTILE (Percentiles)
NB: The other steps (Table/Field notes, Alerts, Business Rules, Custom Metrics) are not implemented right now in my data quality profiling jobs and VA reports but might be used in the future.
As a result, we’ve got 5 tables that shape our data quality Profiling datamart:
- PFO_FLD: master table containing summary results for all fields for all executions
- PFO_FRQDST: frequency distributions for all fields for all executions
- PFO_OUTLR: outliers for all fields for all executions
- PFO_PATDST: pattern frequency distributions for all fields for all executions
- PFO_PTILE: percentiles for all fields for all executions
NB: It was not possible to model only 1 table for all needs because of multiple 1-N relations. This is not a problem because VA is able to build single reports based on multiple data sources.
The first 2 nodes of this process job prepare the environment:
- Define Variables Here: Initialization of macro variables (where to store the datamart; number of values to keep for frequency distributions and pattern frequency distributions)
- FILE Storage Management: adapt the DSN properties even if the repository is a database file repository ( a file with an .rps extension)
This Process Job is “self-repository” based. That is to say, it extracts data quality profiling results from the repository where this Process Job is running. You just have to put this job in whatever repository you want to extract results from. Database file repositories are supported.
This Process Job works only in REPLACE mode. The data quality profiling datamart is overwritten each time it runs. No append or delta mode. All the data quality profiling results need to be kept in the original DataFlux repository.
Next time I’ll talk about the second part: load the data quality profiling datamart into memory and use SAS Visual Analytics to share data quality profiling results wisely.
Concluding note:
Querying the profile repository, while useful, must be used with the understanding that the profile repository schema does change (though it’s rare).

2 Comments
Thanks for Sharing.
I struggled to connect to Repository database file. After digging through few websites found it is SQLite file and it can be read through Data Flux using custom connection.
DFXTYPE=SQLITE;
FILE=C:\Program Files\DataFlux\DMStudio\studio1\AdUpdate_Repos\Address_Update_Repos.rps
https://support.sas.com/documentation/onlinedoc/dfdmstudio/2.7/dmpdmsug/Content/dfU_T_DataConnSQLite.html
Thanks for sharing! Great to see this integration. I look forward to your next post on visualizing and analyzing the data quality profile datamart.