How to manage and govern prompts of large language models with SAS

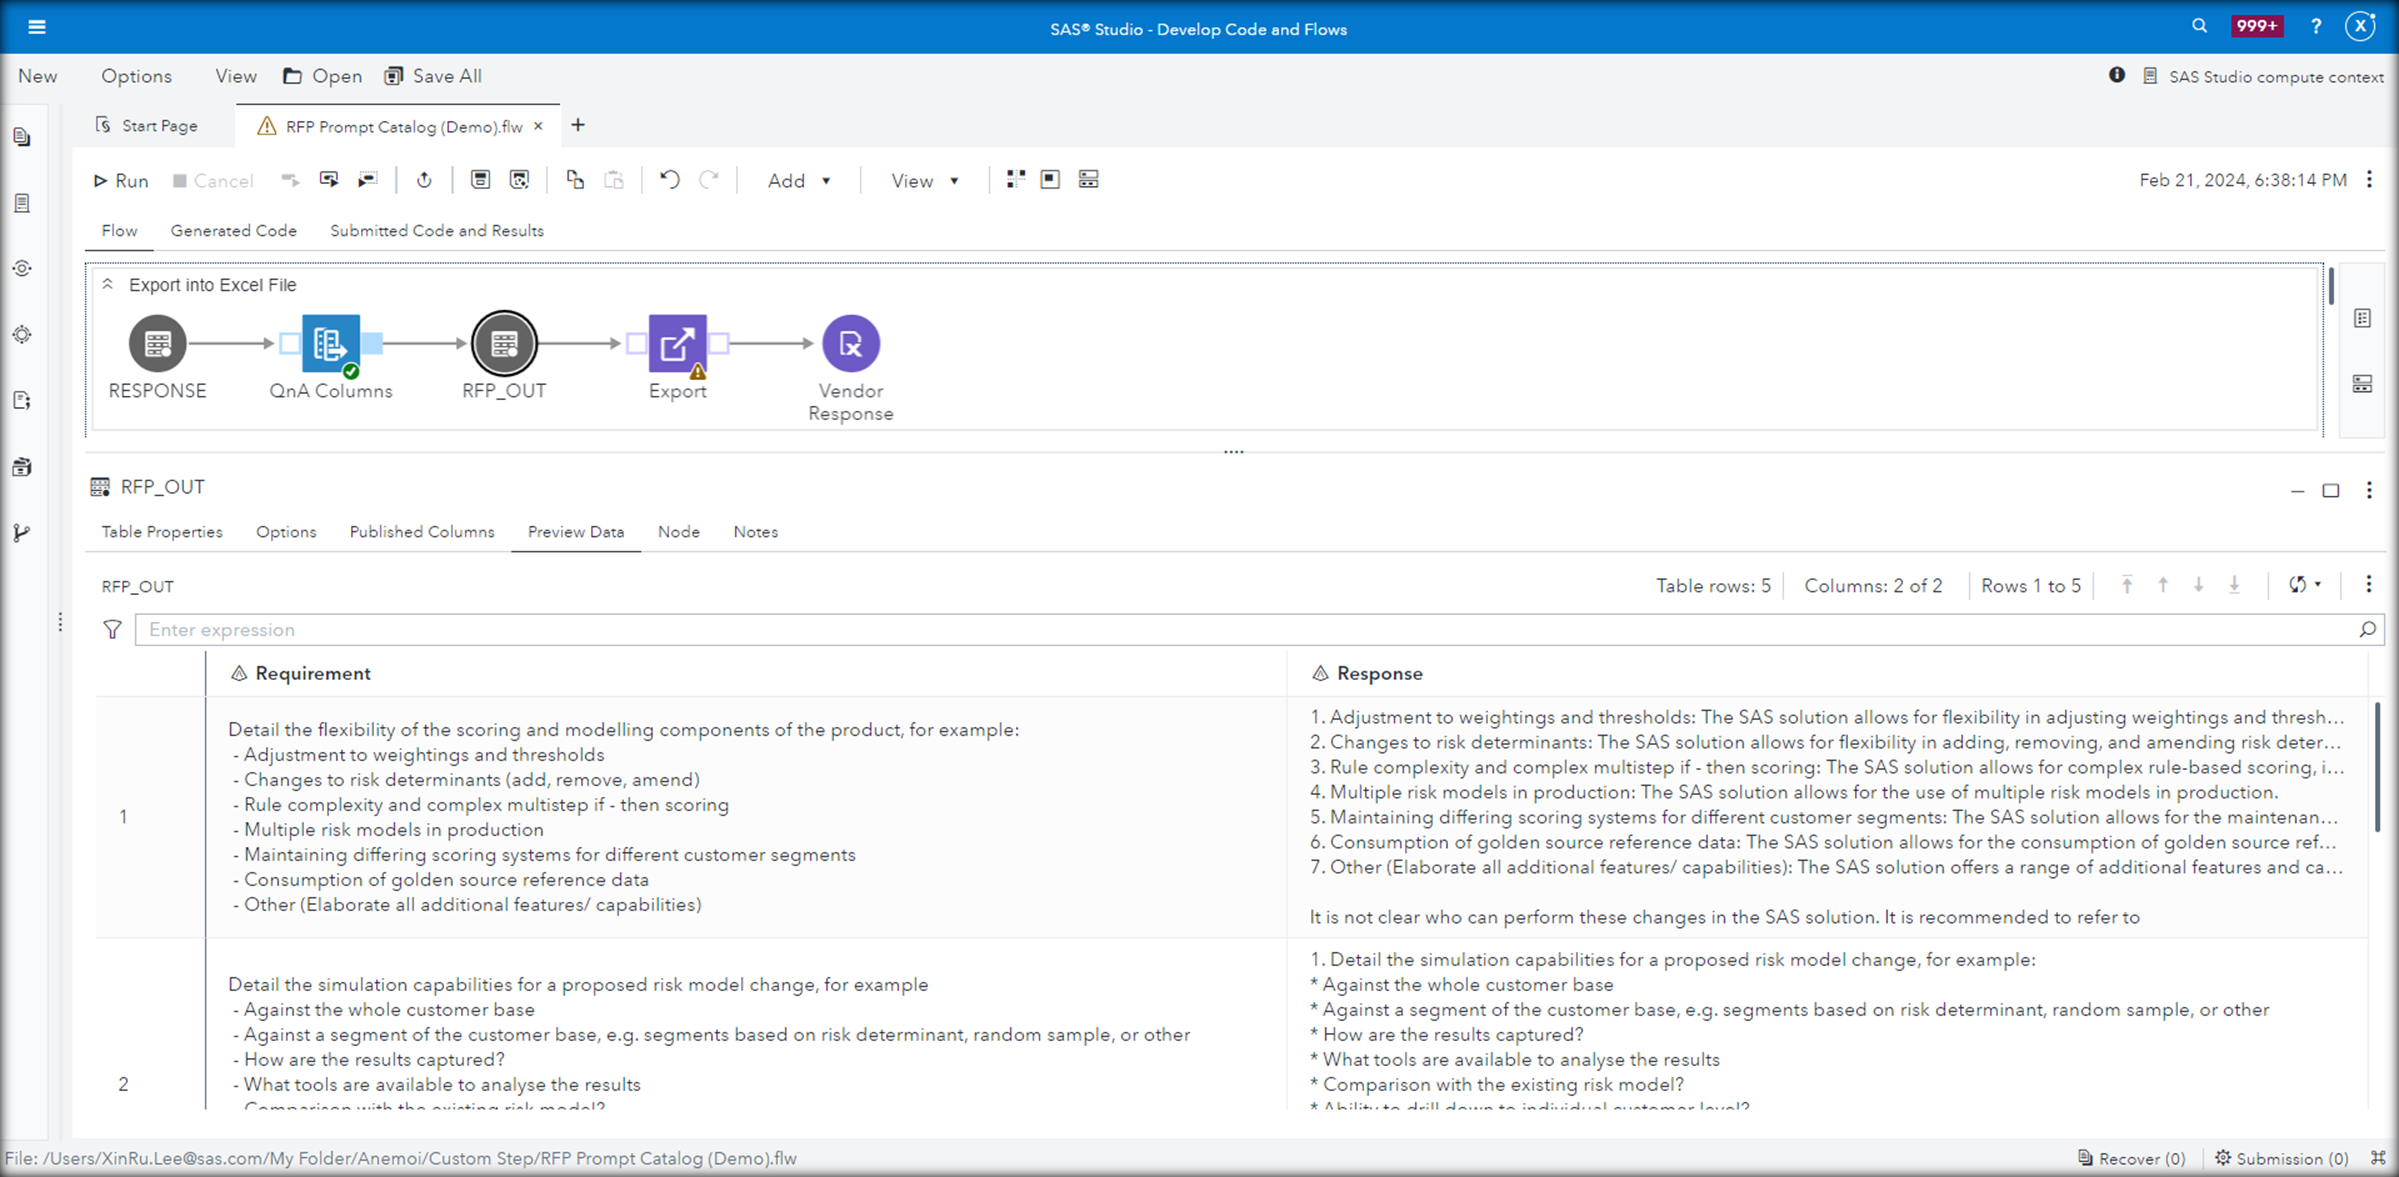
SAS Viya can allow users and organizations to more easily interface with the LLM application, build better prompts and evaluate systematically which of these prompts leads to the best responses to ensure the best outcomes.