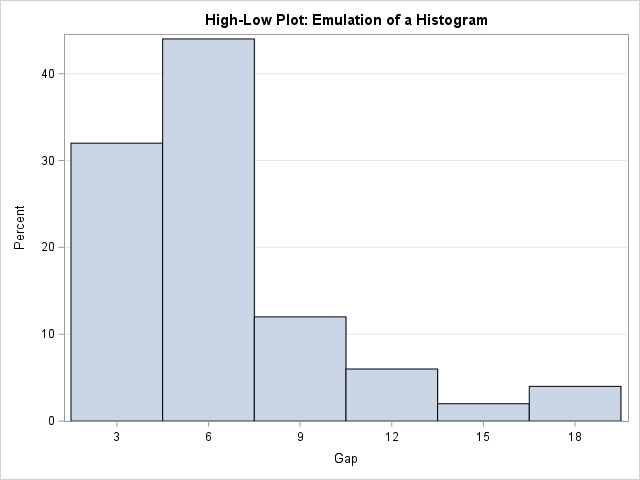
English

Programming Tips
Rick Wicklin 0
The wind chill chart

In cold and blustery conditions, the weather forecast often includes two temperatures: the actual air temperature and the wind chill temperature. The wind chill temperature conveys the cumulative effect of air temperature and wind on the human body. The goal of the wind-chill scale is to communicate the effect of

Advanced Analytics
0
Mathematical optimization at SAS

Note from Udo Sglavo on mathematical optimization: When data scientists look at the essence of analytics and wonder about their daily endeavor, it often comes down to supporting better decisions. Peter F. Drucker, the founder of modern management, stated: "Whenever you see a successful business, someone once made a courageous decision."

Work & Life at SAS
Lisa Allred 0
Love in a Pandemic

  One irony during this pandemic is that single people wish they were partnered and partnered people wish they were single.  Today’s blog post is for the partnered people out there who are struggling with the increased stress and togetherness during this pandemic.  I don’t need to tell you what

Data Visualization
Debpriya Sarkar 0
UpSet Plot using GTL

An UpSet plot is used to visualize intersections of sets. In this post, we will illustrate techniques to create this plot using the Graph Template Language (GTL). We assume that you are familiar with GTL. From the point of view of construction, we leverage the LATTICE layout available in GTL

1 53 54 55 56 57 328