In my new book, I explain how segmentation and clustering can be accomplished in three ways: coding in SAS, point-and-click in SAS Visual Statistics, and point-and-click in SAS Visual Data Mining and Machine Learning using SAS Model Studio. These three analytical tools allow you to do many diverse types of segmentation, and one of the most common methods is clustering. Clustering is still among the top 10 machine learning methods used based on several surveys across the globe.
One of the best methods for learning about your customers, patrons, clients, or patients (or simply observations in almost any data set) is to perform clustering to find clusters that have similar within-cluster characteristics and each cluster has differing combinations of attributes. You can use this method to aid in understanding your customers or profile various data sets. This can be done in an environment where SAS and open-source software work in a unified platform seamlessly. (While open source is not discussed in my book, stay tuned for future blog posts where I will discuss more fun and exciting things that should be of interest to you for clustering and segmentation.)
Let’s look at an example of clustering. The importance of looking at one’s data quickly and easily is a real benefit when using SAS Visual Statistics.
Initial data exploration and preparation
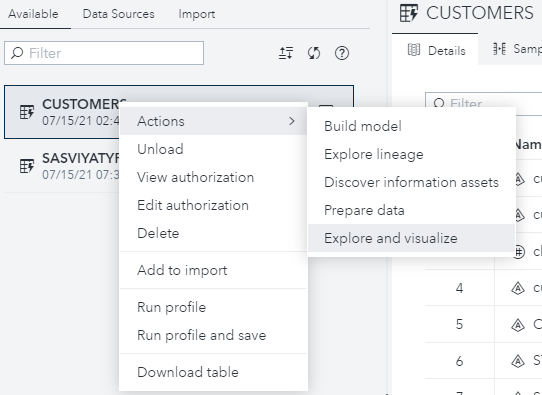
To demonstrate the simplicity of clustering in SAS Visual Statistics, the data set CUSTOMERS is used here and also throughout the book. I have loaded the CUSTOMERS data set into memory, and it is now listed in the active tab. I can easily explore and visualize this data by right-mouse-clicking and selecting Actions and then Explore and Visualize. This will take you to the SAS Visual Analytics page.
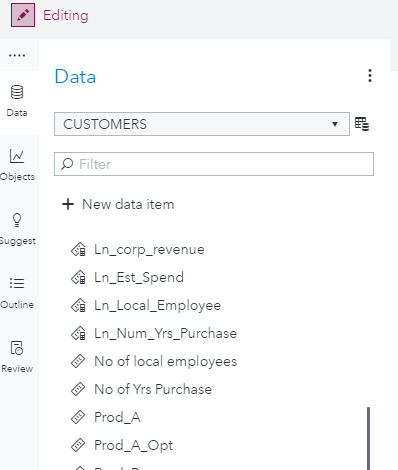
I have added four new compute items by taking the natural logarithm of four attributes and will use these newly transformed attributes in a clustering.
Performing simple clustering
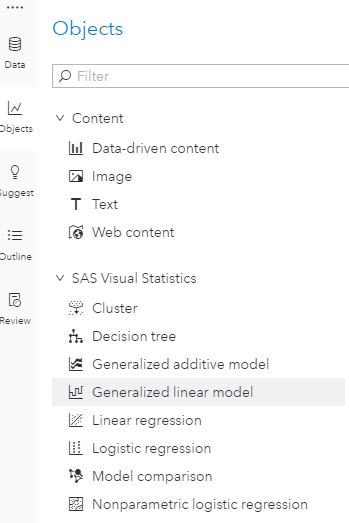
Clustering in SAS Visual Statistics can be found by selecting the Objects icon on the left and scrolling down to see the SAS Visual Statistics menus as seen below. Dragging the Cluster icon onto the Report template area will allow you to use that statistic object and visualize the clusters.
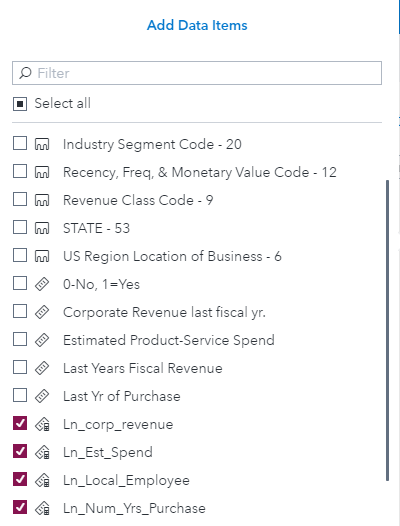
Once the Cluster object is on the template, adding data items to the Data Roles is simple by checking the four computed data items.
Click the OK icon, and immediately the four data items that are being clustered will look like the report below where five clusters were found using the four data items.
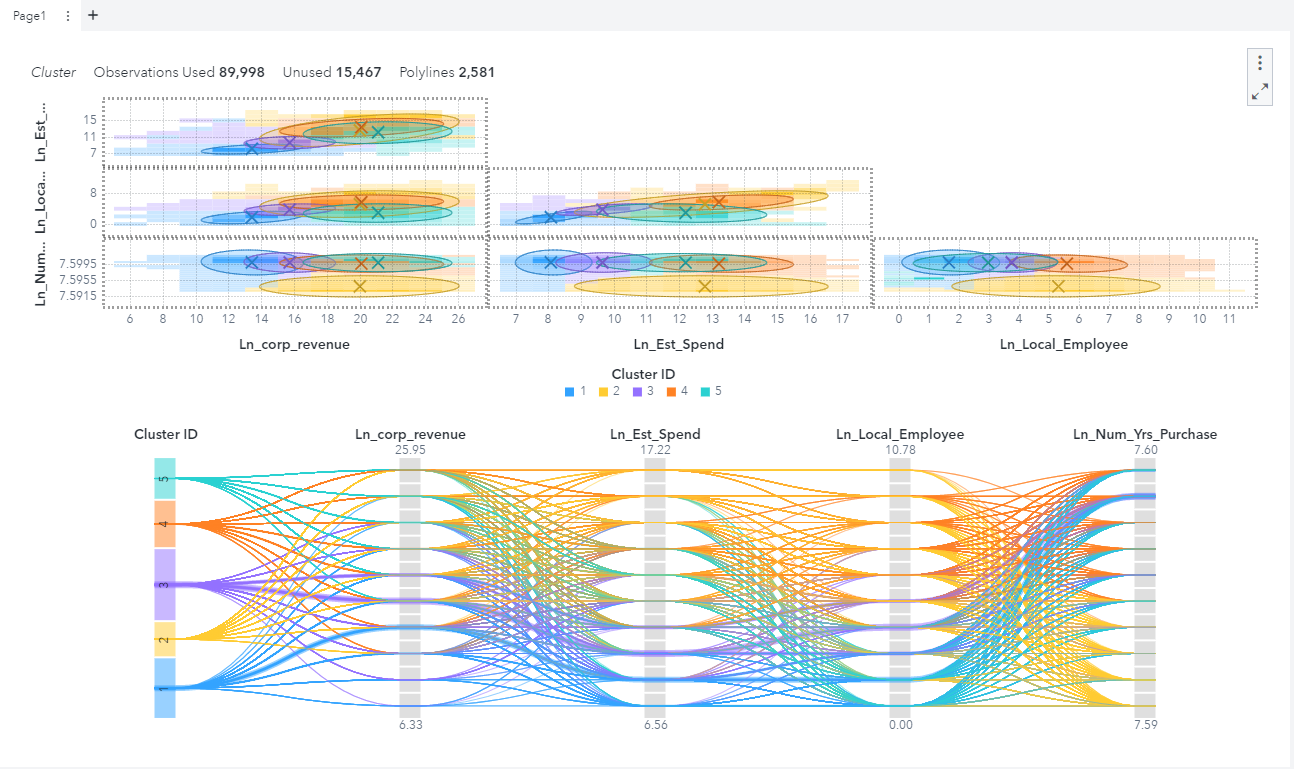
There are 105,456 total observations in the data set, however, only 89,998 were used for the analysis. Some observations were not used due to the natural logarithm not being able to be computed. To see how to handle that situation easily, please pick up a copy of Segmentation Analytics with SAS Viya. Let me know if you have any questions or comments.

3 Comments
Hi Dritan,
Your options are several in VA. You could cross-classify the segments with other categorical attributes such as industry, or region, or RFM cell group, etc. That would give you marginal proportions for each of those. You could also compute basic descriptive statistics and have a report for each cluster on variables of interest. You could also place the data set with the applied clusters into VDMML Model Studio and use the profile node as well. These are just a couple of examples, but if you desired to use R or Python and your Viya platform is configured as such, you could use any desired packages as in addition.
I would be curious about interpretation of these clusters. How to detect which observation belongs to which cluster?
Doing clustering by coding approach such as PROC FASTCLUS allows you to choose cluster seeds and those seeds would serve as centroid and best representative for each cluster.
What would be a good interpretation in SAS VA?
Thank you.
Hi Dritan,
I thought I’d take this more detailed questions off-line of the general book blog. In VA there are ways to develop a visual focusing on each cluster and drill down to the observations that make up that cluster. If that is what you are looking you can make call up the map object, for example, and have a drop down on cluster ID. Then you could display the observations on that cluster of where they might be located physically. Postal code or other geo-mapping indicator would be needed to accomplish that task. Then, you’ll be able to zoom in and out of the map to see which cluster membership each observation has. I hope this explanation helps in some of the possible ideas for your visualization needs.