How long do dogs live? ... That's a good/tough question. Some live longer than others, but what are the determining factors? Let's throw some data to this problem, and see if we can fetch some answers!
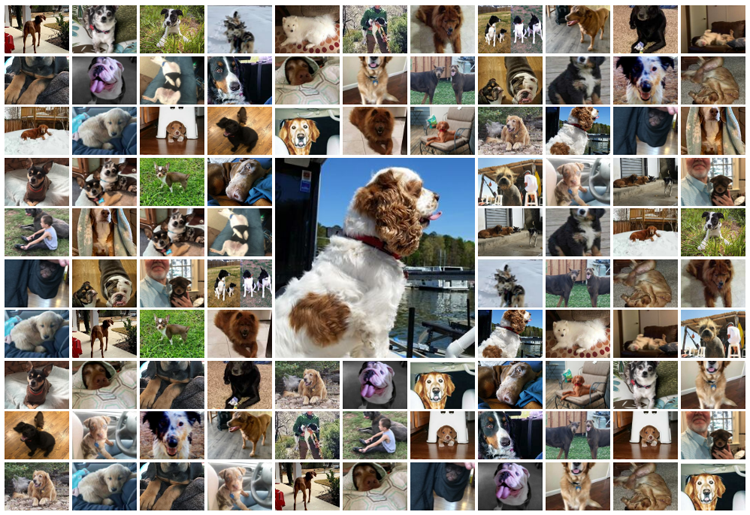
But before we get started, how about a random picture to get you into the mood for a dog blog...
I naively asked my Facebook friends if any of them had a picture of their dog that I could use in this blog - little did I know the 'flood' that would ensue... It seems that all of my Facebook friends are dog owners, and they all had a picture (or two) that they were happy to share. It was too difficult to pick a favorite, so I put them all in a collage:
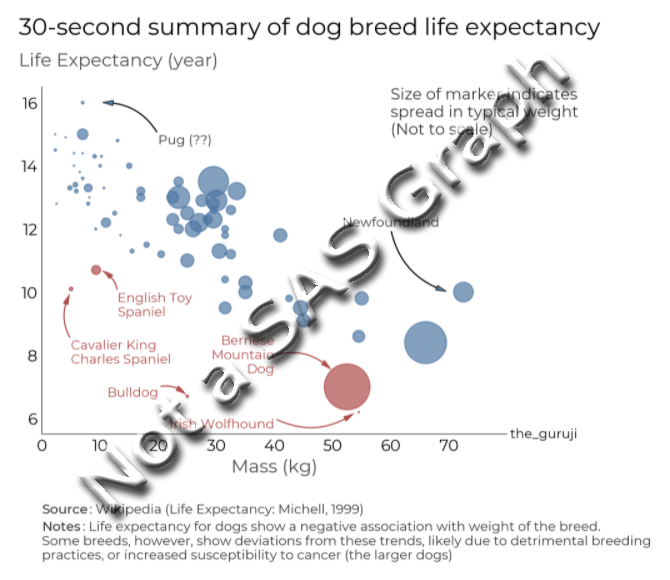
The Original Graph
The following graph on Reddit is what got me thinking about this topic. It seems to indicate that there is a fairly strong relationship between a dog's life expectancy and weight. I thought their graph was an OK way to represent the data in general. One problematic feature was using bubble sizes to represent the weight range of the breeds - that seemed a little confusing. And I'm not sure of the significance of the "30-seconds" they mention in the title. The curved arrows could also be misleading - I originally thought they represented 'movement' from point A to point B.
 The Data
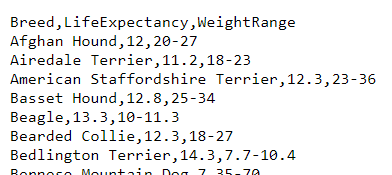
Thankfully the graph author mentions the data source in the Reddit comments. They got the life expectancy from this Wikipedia page, and then the weight ranges from the pages for the individual breeds. Collecting the weight ranges for each breed was probably a lot of work, and I'm thankful the author included a link to their final data! Here's a screen-capture showing what a few lines of their data looks like:
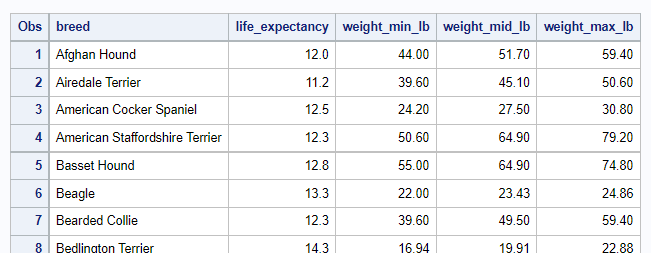
I copy-n-pasted the csv text data into the datalines section of my SAS job, and then massaged it a bit. I parsed the weight range into two separate variables, and converted them from kilograms to pounds (I know, I know - but we do pounds here in the US ... and we like it!) I also calculated a value midway between the minimum and maximum (weight_mid_lb) - this is where I plot the scatter markers.
My New/Improved Graph
I started simple, with just a scatter plot of the life expectancy along the left axis, and the weight along the bottom axis (since I needed a single value for the weight, I used the 'mid' value).
proc sgplot data=my_data noautolegend;
scatter y=life_expectancy x=weight_mid_lb / markerattrs=(color=red size=10);
run;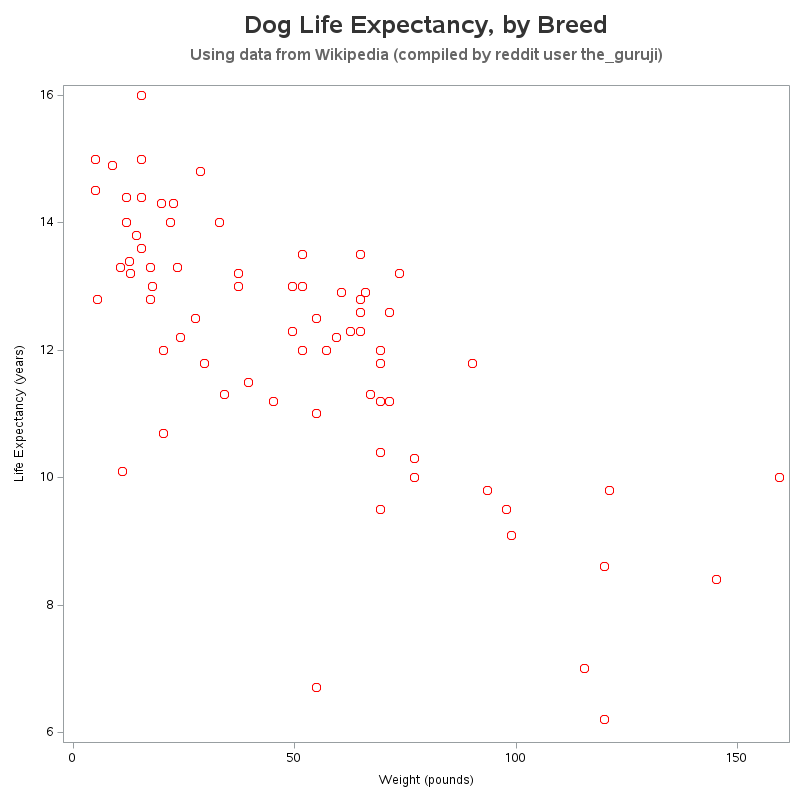
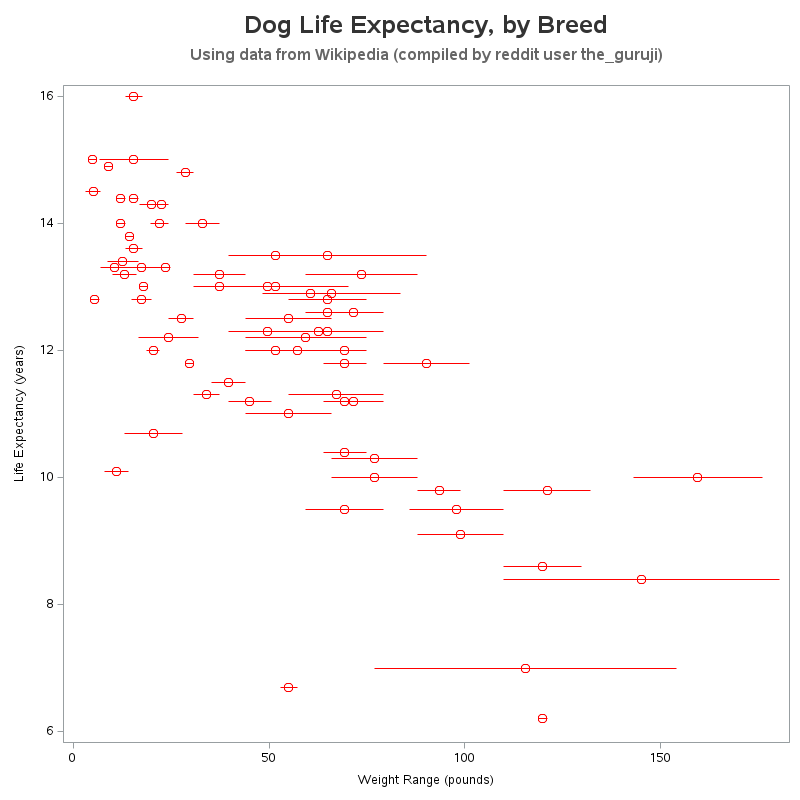
But there's a bit more information in the data (the minimum and maximum weight for each breed), and I don't want to lose that. In the original plot, they tried to represent the weight range with the size of the markers (or bubbles) - that confused a lot of people, and got a lot of negative comments in the Reddit thread. Therefore I took a simpler, more direct approach. I draw a horizontal line from the minimum weight to the maximum weight for each breed (using SGPlot's highlow statement).
proc sgplot data=my_data noautolegend;
highlow y=life_expectancy low=weight_min_lb high=weight_max_lb / lineattrs=(color=red);
scatter y=life_expectancy x=weight_mid_lb / markerattrs=(color=red size=10);
xaxis label='Weight Range (pounds)';
run;
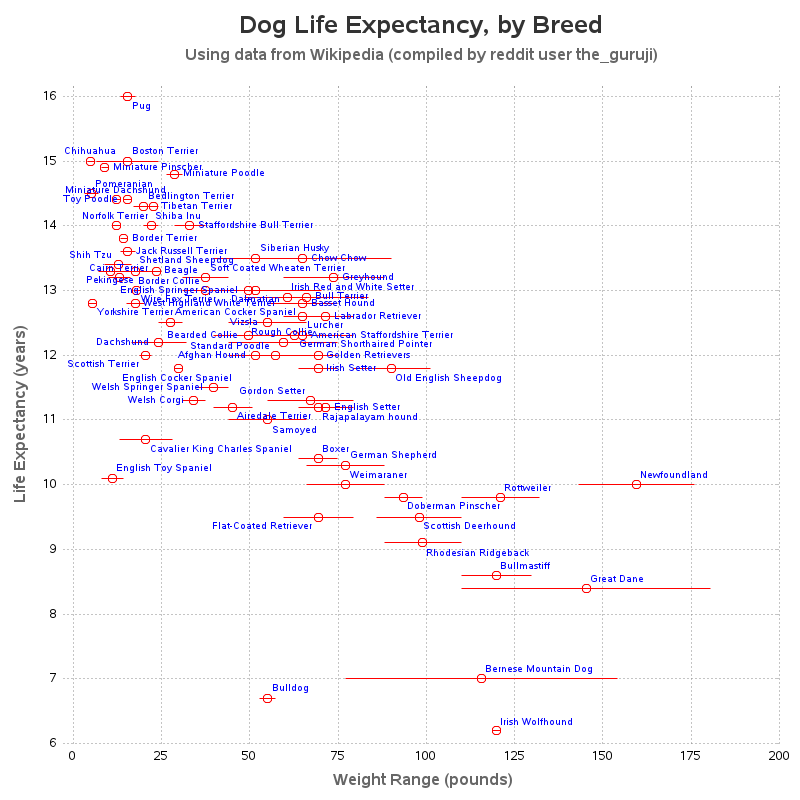
If you're viewing the interactive HTML version of the graph, you could see the dog breed in mouse-over text. But here in the blog (and other places you might want to show such a graph), it would be nice to show the breeds on the graph. With so many plot markers to label, it becomes a bit crowded/cluttered, but the text is still readable (for the most part), therefore I went ahead and added text labels for the breeds (using the datalabel= option on the scatter statement).
Below is my final code. I add a few extra commands, to get the axes just like I want them, and also add grid lines.
proc sgplot data=my_data noautolegend noborder;
highlow y=life_expectancy low=weight_min_lb high=weight_max_lb / lineattrs=(color=red);
scatter y=life_expectancy x=weight_mid_lb / markerattrs=(color=red size=10)
datalabel=breed datalabelattrs=(color=blue);
yaxis display=(noline noticks) offsetmin=0 values=(6 to 16 by 1)
labelattrs=(color=gray66 size=12pt weight=bold) grid gridattrs=(pattern=dot color=gray88);
xaxis display=(noline noticks) offsetmax=0 values=(0 to 200 by 25)
label='Weight Range (pounds)' labelattrs=(color=gray66 size=12pt weight=bold)
grid gridattrs=(pattern=dot color=gray88);
run;
Did you learn anything about your dogs? (past, present, or future). Did you learn anything about graphing data in SAS? Hopefully a bit of both! 🙂
Feel free to leave a note about your favorite dog in the comments!


7 Comments
I loved this blog Robert, Any dog lover would just love it. I had a pug many years ago who passed way before your mentioned life expectancy 🙁 . I have a beagle now who is already 10+ yrs.
A special mention about your collage I magnified it and saw each and every tiny pic 😀
Glad to hear you enjoyed the blog - and the collage! 🙂
A much improved graph makeover and using the SGPlot's highlow statement is a great approach!!!
The dog collage sure is eye catching as well as the data subject. I miss our Labradors that had long lives at 13 and 10 years. I thought the average age was 12 (the graph has 12 1/2) and I used a pounds to kilograms converter to check out the weight range 😉
Sure is interesting to see the wide span weight range for larger dogs (e.g. Bernese Mountain Dog) versus the small weight range for smaller dogs (e.g. Norfolk Terrier) Also noticing the denseness in the upper left of the graph suggesting the longer life expectancy of smaller dogs.
Would love to see an area where you could select multiple breeds to filter the output. I have a dog that is a mix of several breeds, and it would be cool to select the components of the mix to see the data for each of the breeds.
A really cool output, I love this project.
Nice idea!
Daughter commented that this was depressing info. But I think it provides important context to those difficult conversations with vets on cost of care at the expected end of life. Thanks for the graphs!!
Next time I blog about "death" I'll try to leave on a more cheerful note! (actually, I'm working on another one now!) 🙂