Florence Nightingale, or the lady with the lamp, is widely known for treating wounded soldiers in the Crimean War of the 1850s. She is famous for her compassion and high nursing standards. However, there is another side to the story of her involvement in the Crimean War: her use of data to revolutionise the nursing practice. The picture above shows her with paper in hand, and I like to think she is documenting the trends at the field hospital she was visiting.
Florence Nightingale was truly a big user of data. She collected all different types of data and used them to produce descriptive statistics. After the Crimean War, she collected her main findings in the book Notes on matters affecting the health, efficiency, and hospital administration of the British Army: founded chiefly on the experience of the late war. Contemporary analysts even used her data as the basis for illustrations in their own work. One example is in the publication Mortality of the British army: at home and abroad, and during the Russian war, as compared with the mortality of the civil population in England. Which is where the following graph is from:
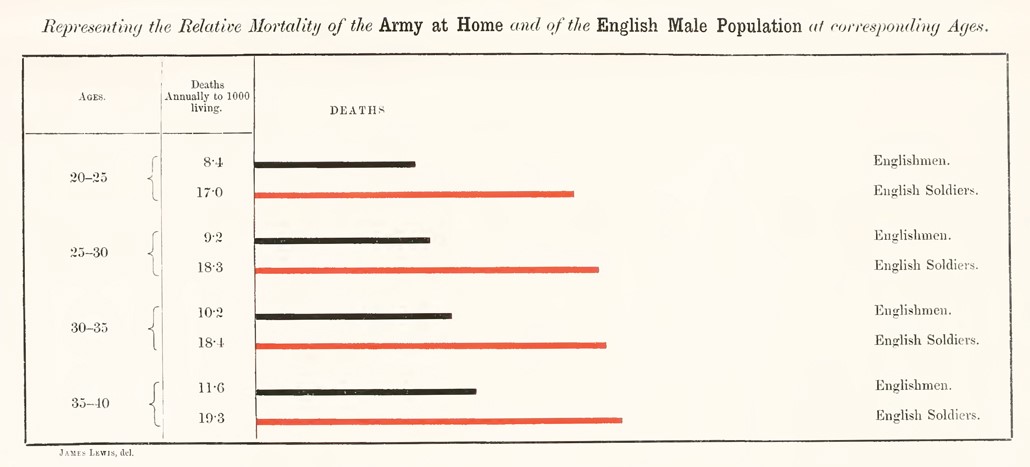
This graph compares mortality between the army at home and the general male population by age group. The data Nightingale collected challenges the general assumption that battle wounds kill soldiers. But by looking at the army at home, Florence Nightingale was able to argue her case that diseases are the main cause of mortality in the army, not battle wounds. This conclusion was far ahead of its time.
Data visualisation
We can only argue that Nightingale also had an understanding of data that was equally far ahead of its time. To put it into context, at the time of the Crimean War, the term standard deviation had not yet been defined (this is attributed to Karl Pearson in 1894). Have no doubt, this graph was at the cutting edge of statistics. However, there is more.
She did not only rely on others to show her work but also mastered the art of visualisation. Florence Nightingale’s most famous visualization is probably the rose plot:
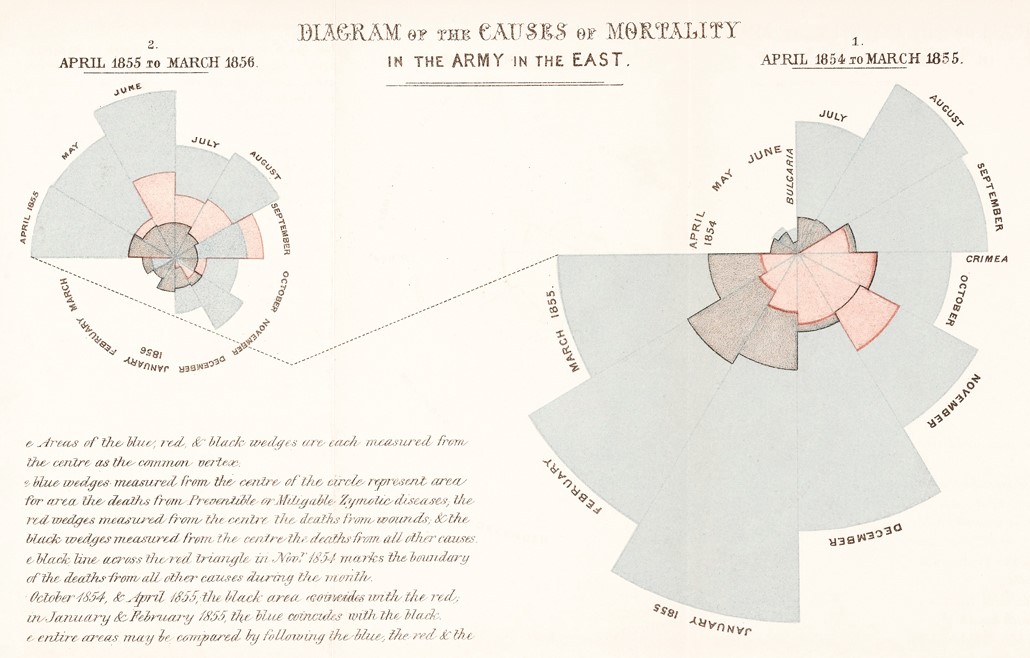
One quick glance tells the viewer that diseases (blue wedges) killed far more soldiers than wounds (red wedges) or any other causes (black wedges). This hard-hitting visualisation clearly highlighted Nightingale’s point about the impact of disease and helped to ensure that the problem was tackled better in the future.
A lesson from the past
Today, coincidentally, we face many of the same problems that Florence Nightingale was trying to manage. For example, health care services often need to minimise the risk of infections for an at-risk population. Hospital-acquired infections are a critical issue for the health sector and cause 3,000 deaths per year in Denmark alone. This was recently addressed by the Region of Southern Denmark and SAS institute. The work was successful in reducing the number of urinary infections by a third. You can read more in a recently published open access academic paper.
But how does all of this relate to democratizing analytics? We live in a world where modelling is extremely complex. We, therefore, need to consider the barriers to entry for developing models. There are challenges in streamlining the value chain from data to decisioning, while also ensuring that the right people are doing the modelling. The right person is not necessarily someone who is proficient in coding. Instead, like Nightingale herself, we need people who understand the problem and can ensure that the model is as effective in the real-world application as possible.
For example, when working with natural language processing, the output needs to be put into context. This means using a business expert, not a data scientist. This can be extended to most other models. Their interpretation and further development will almost invariably benefit from the insights of business experts.
This means that we need analytics tools that allow analysts to collaborate with business users – and enable business users to understand the outcomes. We need, in other words, to democratise analytics in the true sense of the word, by making analytics accessible to everyone.