
Decisions and doom loops – AI for a better financial future

The commercial real estate crisis is looming for insurers and banks. Learn how AI decisioning can help.
The commercial real estate crisis is looming for insurers and banks. Learn how AI decisioning can help.
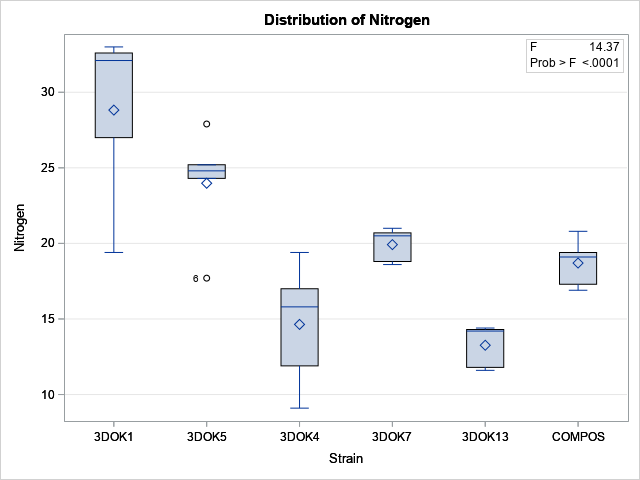
In practice, there is no need to remember textbook formulas for the ANOVA test because all modern statistical software will perform the test for you. In SAS, the ANOVA procedure is designed to handle balanced designs (the same number of observations in each group) whereas the GLM procedure can handle
The small and medium-sized business segment is growing – in the US and worldwide – and SAS has the expertise and drive to support them. Nowhere was that more evident than at the SAS headquarters when Susan Duchesneau, Head of North America SMB Practice at SAS, welcomed more than 100

