4 core insurance functions primed to benefit from agentic AI

Agentic AI in insurance has potential to transform insurance. Read four use cases.
Agentic AI in insurance has potential to transform insurance. Read four use cases.
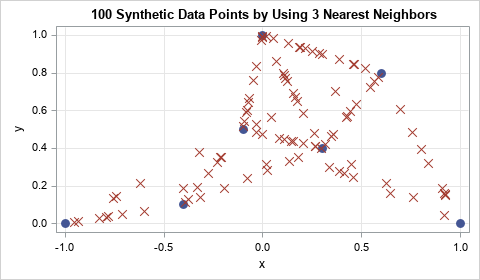
The Synthetic Minority Over-sampling Technique (SMOTE) was created to address class-imbalance problems in machine learning algorithms. The idea is to oversample from the rare events prior to running a machine learning classification algorithm. However, at its heart, the SMOTE algorithm (Chawla et al., 2002) is essentially a way to simulate
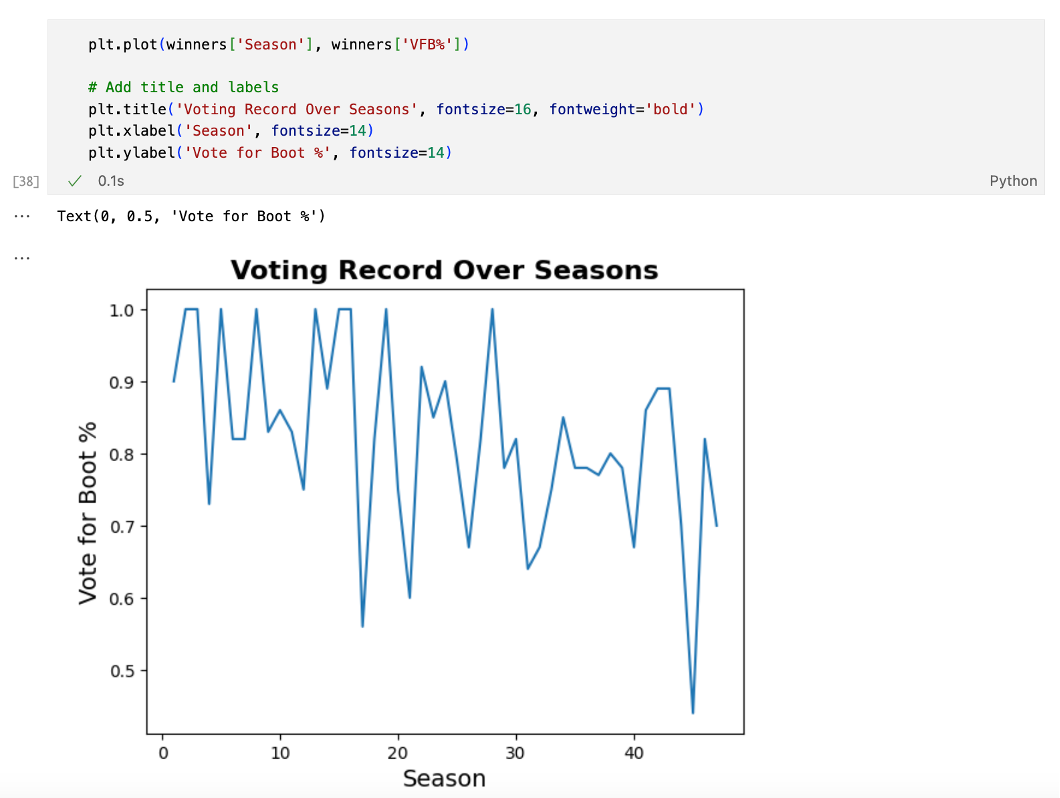
Using 47 seasons of Survivor data, this analysis explores what gameplay traits correlate with winning, applying Python and SAS Viya Workbench to build predictive models. While stats like challenge wins and voting accuracy help narrow down potential winners, the findings suggest that intangible social dynamics play the most decisive role.