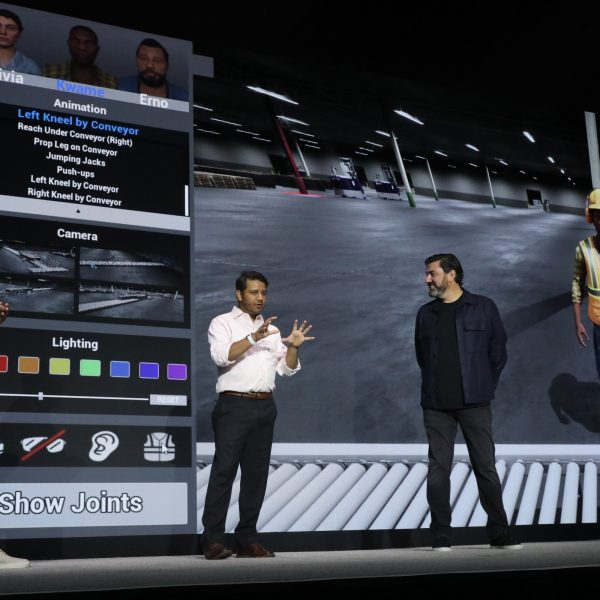
Could data governance policies for analytics be the foundation for a model governance program?
One of the features of SAS Grid Manager (and SAS Grid Manager for Platform) introduced in SAS 9.4 M6 is the capability for the grid provider software to handle open-source workloads in addition to traditional SAS jobs. In this post, we’ll take a look at the steps required to get your SAS Grid Manager environment set up to utilize this functionality, and we’ll demonstrate the process of submitting Python code for execution in the SAS Grid.
The world of sports has been deploying analytics to improve both fan engagement and athlete performance. The Hungarian State Lottery believes there is a third use case – to improve engagement with gamers. Which is why the organisation has partnered with SAS on the upcoming Hungarian Hackathon. The lottery's online
In a scatter plot that displays many points, it can be important to visualize the density of the points. Scatter plots (indeed, all plots that show individual markers) can suffer from overplotting, which means that the graph does not indicate how many observations are at a specific (x, y) location.
One of the most common questions I encounter in my work is some variation of “How can I make Mom/Dad/Grandma/Grandpa take better care of themselves, realize they need to move to long term care, stop driving", ... you get the picture.
Customer identity is a precious asset and a highly prized commodity. As the financial services industry has become more digitised down the years, customers' digital identity decides what they can do and what online services they have access to. This has been revolutionary for the customer experience. So long as
North Carolina is one of those key "swing states" that might possibly decide a national presidential election. And with such an election coming up next year (2020), I thought I would have a look at the voter registration data to see how it has changed since the previous presidential election
Just when you think you’ve seen it all, life can surprise you in a big way, making you wonder what else you've missed. That is what happened when I recently had a chance to work with the SAS® Scalable Performance Data Server, a product that's been around a while, but
Around the world, combating public sector fraud is a major problem. "Benefits cheats" get the most media attention, but are by no means the biggest loss. Tax fraud is also a huge issue. And some estimates suggest that procurement fraud could dwarf both in terms of both scale and complexity.
A moving average is a statistical technique that is used to smooth a time series. My colleague, Cindy Wang, wrote an article about the Hull moving average (HMA), which is a time series smoother that is sometimes used as a technical indicator by stock market traders. Cindy showed how to
Time-series decomposition is an important technique for time series analysis, especially for seasonal adjustment and trend strength measurement. Decomposition deconstructs a time series into several components, with each representing a certain pattern or characteristic. This post shows you how to use SAS® Visual Analytics to visually show the decomposition of
Earlier this year I was lucky enough to attend the BT Young Scientist & Technology Exhibition with my colleague Alan McGlinn at the RDS in Dublin. If you’re in Dublin in January, I thoroughly recommend a visit. The event is vast, and I was humbled by the level of expertise,
The SAS Forecasting R&D team has an open position for a Forecasting and Machine Learning Specialist (apply here). What you’ll do As a Forecasting and Machine Learning Specialist on the SAS Forecasting R&D team, you will help create innovative software to apply cutting-edge statistical methods to automated enterprise-scale business forecasting processes. You will:
How do we make the world a better place? It’s a question that’s tickled many a worthy brain over the centuries – and now the answer is closer than ever. Data can make the world a better place. Data is why we don’t live in caves anymore, why we moved
Yesterday we had a 'special election' here in NC, to elect new members to the House of Representatives for Congressional Districts 3 and 9. The election got a lot of national news coverage, therefore I thought people might like seeing the results plotted on a map. Before I decided to
前回は、ビジネス価値創出につながる「オペレーショナル・アナリティクス for Data Scientist」ユースケースの論文を紹介しました。今回は、企業様にとって、クラウド上のインフラアーキテクチャと分析プラットフォームのデプロイメントについて、ご紹介します。昨今、なぜ「コンテナ」が注目されているのか、そして、クラウドやコンテナ上に分析プラットフォームを移行/構築し、活用することに関心があるのであれば、ぜひ最後までご覧ください。 1.Cows or Chickens: How You Can Make Your Models into Containers モデルは特定の作業(新しいデータをスコアリングして予測を出すこと)として役割を果たしてきています。一方、コンテナは簡単に作成し、廃棄し、再利用できることができます。実際、それらは簡単にインテグレートさせ、パブリッククラウドとオンプレミス環境で実行できます。SASユーザは本論文を通じて、簡単にモデルの機能をコンテナに入れることができます。例えば、パブリッククラウドとオンプレミス環境でのDockerコンテナ。また、SASのModel Managerは様々なソース(オープンソース、SAS、コンテナ等々)からモデルの管理を行うことができます。したがって、この論文はそれらの基本知識と、どのようにSASの分析モデルをコンテナに入れることをメインに紹介します。 2.Orchestration of SAS® Data Integration Processes on AWS この論文では、Amazon Web Services(AWS)S3でのSASデータインテグレーションプロセスの構成について説明します。例としては、現在サポートしているお客様がクレジット報告書を生成するプロセスを毎日実行しています。そして、そのお客様の対象顧客は1カ月ごとに1回その報告を受け取ります。データ量としては、毎日に約20万の顧客情報が処理され、最終的に毎月約600万人の顧客へ報告することとなります。プロセスはオンプレミスデータセンターで始まり、続いてAWSのSASデータインテグレーションでAPR計算が行われ、最後にオンプレミスデータセンターで報告書が生成されます。さらに詳しい情報としては、彼らのアーキテクチャ全体はマイクロサービスを使われていますが、同時にAWS Lambda、簡易通知サービス(SNS)、Amazon Simple Storage Service(Amazon S3)、およびAmazon Elastic Compute Cloud(EC2)などの独立した高度に分離されたコンポーネントも使われています。つまり、それらにより、データパイプラインに対するトラブルシューティングが簡単になっていますが、オーケストレーションにLambda関数を使用することを選択すると、プロセスがある程度複雑になります。ただし、エンタープライズアーキテクチャにとって最も安定性、セキュリティ、柔軟性、および信頼性もあります。S3FやCloudWatch SSMのようなより単純な代替手段がありますが、それらはエンタープライズアーキテクチャにはあまり適していません。 3.SAS® on Kubernetes: Container Orchestration of Analytic Work Loads 現在、Big Dataの時代で、Advanced analyticsのためのインフラストラクチャに対するニーズが高まっています。また、分析自体に対して、最適化、予測が最も重要領域であり、小売業、金融業などの業界ではそれぞれ、分析に対する独自の課題を抱えています。この論文では、Google Cloud
If you sometimes sneak in a quick dinner while driving your kids to practice or a hold a sandwich in your left hand while typing the last few lines of your project with your right, then you are no stranger to distracted eating. Or maybe the big surprise ending to
Taking a decision is easy. However, living with the outcome might be problematic because every decision is a choice that leads us to an action that will affect others. And trust – what about this elemental human feeling? As children, we trust our parents. This kind of trust forms the
I often use axis tables in PROC SGPLOT in SAS to add a table of text to a graph so that the table values are aligned with the data. But axis tables are not the only way to display tabular data in a graph. You can also use the TEXT
I recently had the incredible opportunity to attend SAS Global Forum in Dallas as a presenter and New SAS Professional Award recipient. At the conference, I was able to learn more about SAS features and applications, share my knowledge of SAS applications in the clinical trials space, and make new
Sibos 2019 kicks off in London in three weeks, and the theme for this year is "Thriving in a hyper-connected world." The market has long demanded quicker and more convenient payment methods, and the industry is now answering with ubiquitous payments. Yet at what cost? PSD2 and open banking are
SASPy is a powerful Python library that interfaces with SAS and can help with your machine-learning solutions. SASPy was created for Python programmers to leverage the power of SAS within their Python scripts. If you are not familiar with SASPy, see the following resources: Introducing SASPy: Use Python code to
If you consume NBA content through social media, then you know just how active that online community is. Basketball arguments and ‘hot takes’ on the Internet are about as commonplace as Michael Jordan playing golf instead of running a functional NBA front office. I wondered if NBA fans happened to
Editor's Note: This article was translated and edited by SAS USA and was originally written by Makoto Unemi. The original text is here. SAS previously provided SAS Scripting Wrapper for Analytics Transfer (SWAT), a package for using SAS Viya functions from various general-purpose programming languages such as Python. In addition
The TEXT statement in PROC SGPLOT supports the ROTATE= option to rotate the specified text. It is worth knowing how the ROTATE= option interacts with the POSITION= option, which determines the anchor point at which the text is positioned. Briefly, the text is positioned FIRST, then the rotation occurs. The
I have been meeting with lots of parents recently to discuss their parenting challenges. The converstaion always comes aorund to some simple techniques they can use to help their children deal with frustration. When my child was 3, I made up and taught her these simple steps: 1 deep breath
Today, September 8th, is International Literacy Day! A day celebrated by UNESCO since 1967 to emphasize the importance of literacy around the world. Here at SAS, we have decided to highlight data literacy, a critical part of our evolving knowledge as data and analytics continue to dominate the way we
By 2020, 50% of organizations will lack sufficient AI and data literacy skills to achieve business value. – Gartner What is data literacy? Data literacy is the ability to read, work with, analyze, and argue with data. – Wikipedia Data literacy is the ability to derive meaningful information from data,
The Europe-wide PSD2 implementation deadline will fall on 14 September. In the UK, it has now been confirmed that the official compliance deadline for the Secure Customer Authentication section of the regulation will be pushed out to March 2021. UK companies must be able to demonstrate that they are moving
Today's blog is written by Paige Orlandi-Holmes, a Licensed Therapist providing mental health counseling services at Counseling Professionals PLLC, a private practice with offices in Cary and North Raleigh. The Work/Life Team is so thankful when therapists from the community volunteer to share their expertise with our employees and