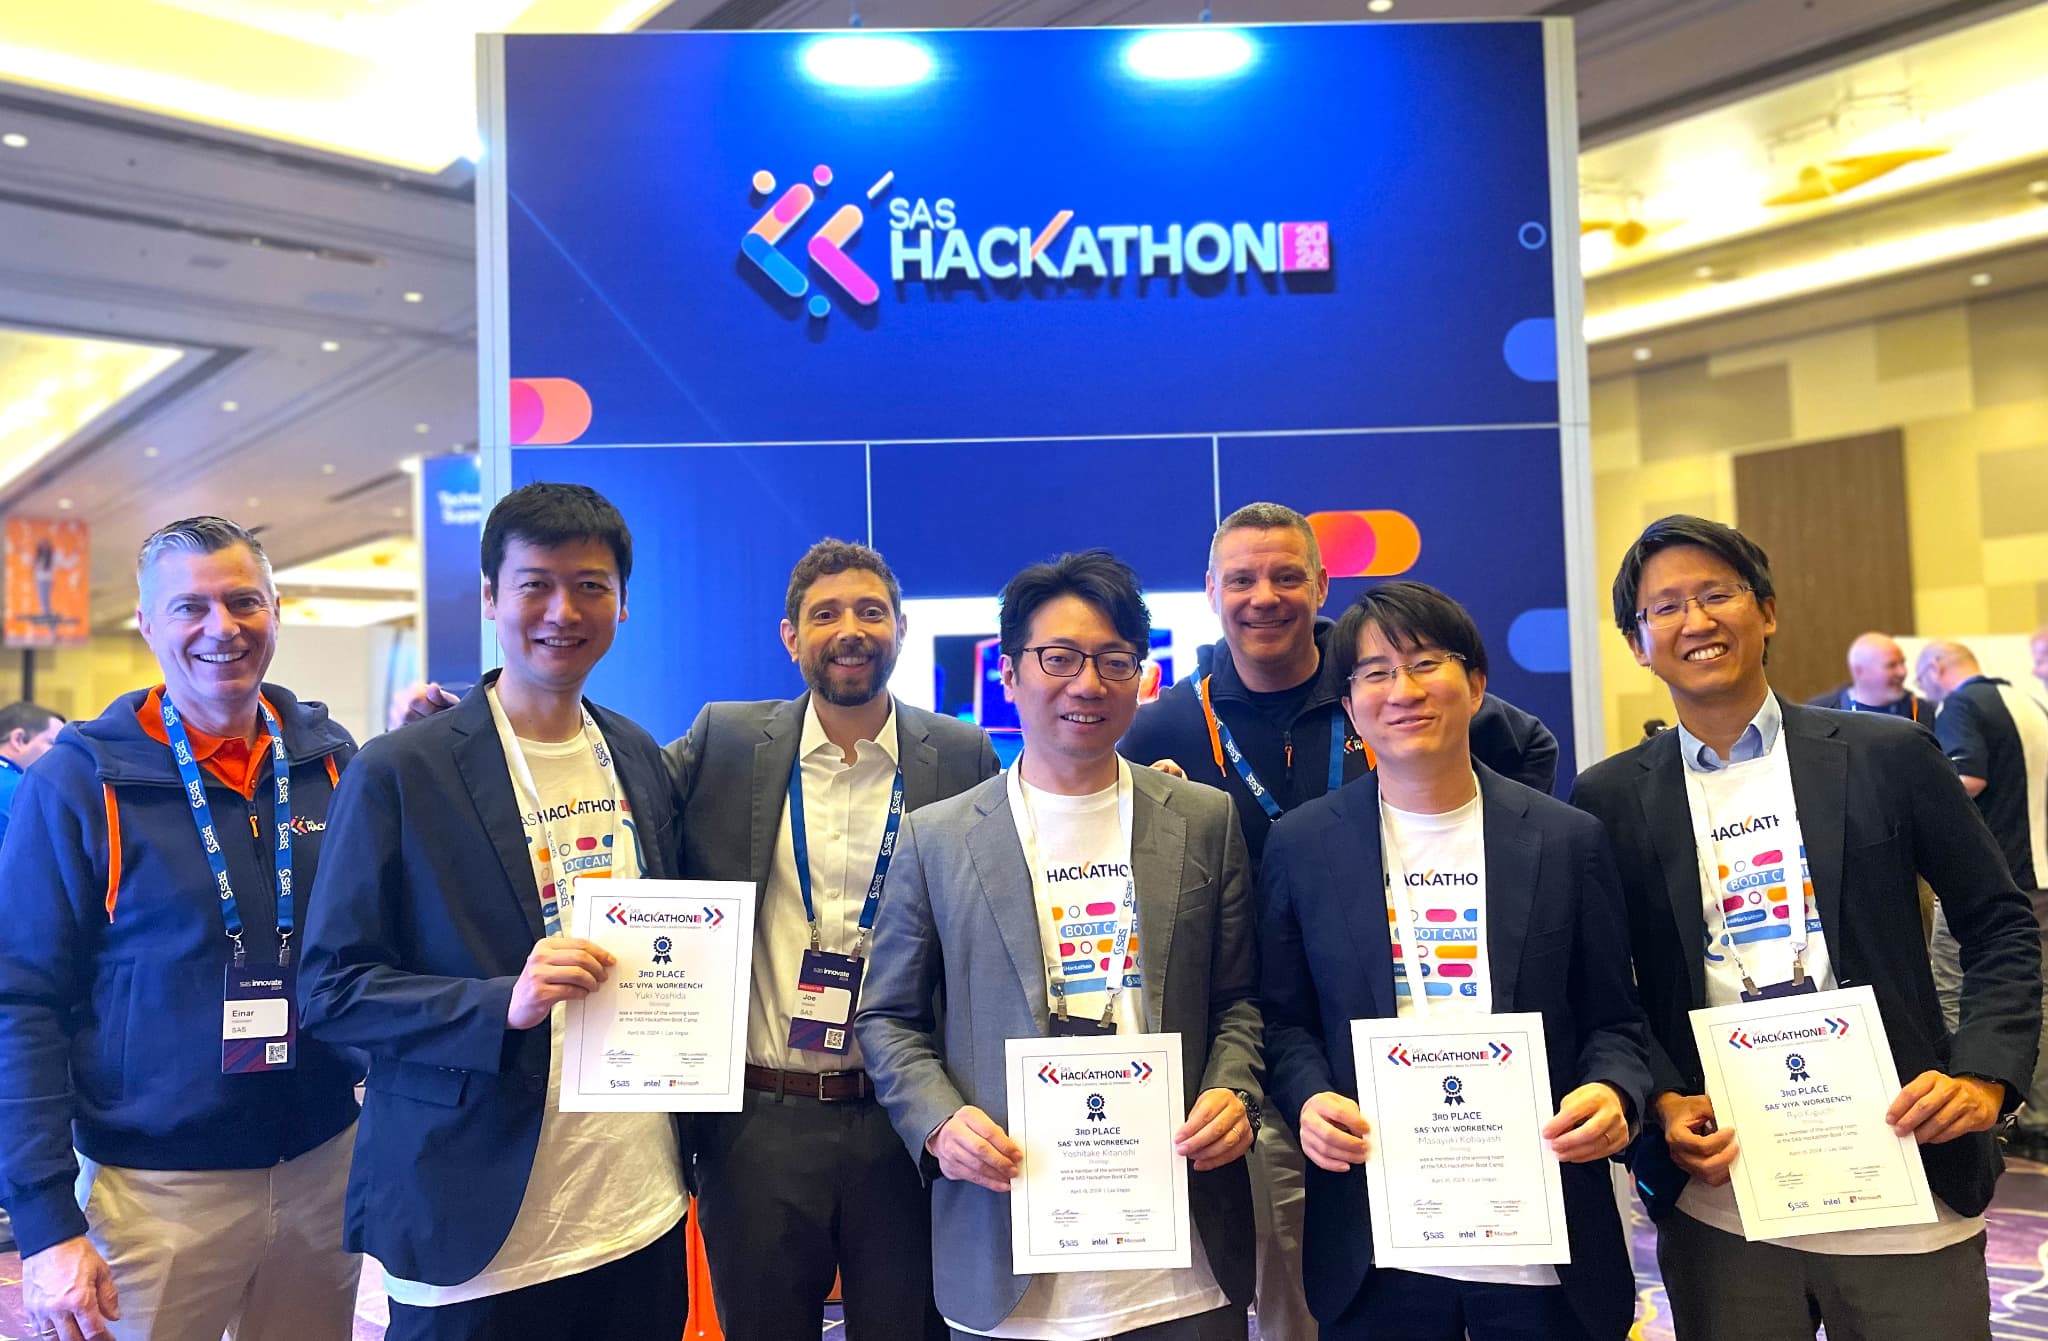
![](https://blogs.sas.com/content/saskorea/files/2019/03/IOT1-2.jpg)
4월 9일은 지난 2010년 시작된 국제 ‘사물인터넷의 날(IoT Day)’입니다. ‘사물인터넷 위원회(IoT Council)’는 사물인터넷이 일상화돼 이웃의 세탁기까지 서로 연결될 수 있는 미래에 대해 생각해보자는 취지로 사물인터넷의 날을 지정했는데요. 실제 모바일 쇼핑부터 석유 굴착 노동자의 안전과 심장병 환자의 건강에 이르기까지 사물인터넷은 가정, 회사, 산업 현장 등 일상 속 모든 분야에서 점점 더 중요해지고
Being the Graph Guy, I wanted to know about all the "data visualization" presentations at the upcoming SAS Global Forum 2018 conference. I tried going through the official interface to search for such sessions, but it was difficult (impossible?) to know that I had found them all. Therefore I created
When speed is required at scale, it's hard to beat parallel processing data in memory with DS2 and SAS® Viya® with the amazing Cloud Analytic Services (CAS)!
Correlation is a statistic that measures how closely two variables are related to each other. The most popular definition of correlation is the Pearson product-moment correlation, which is a measurement of the linear relationship between two variables. Many textbooks stress the linear nature of the Pearson correlation and emphasize that
In meinem letzten Blogbeitrag habe ich mit Anja Stolz, CMO bei der Commerzbank, über die Bedeutung von Kundenzufriedenheit und Kundenbeziehungen im Bankenwesen gesprochen. In diesem Beitrag führen wir unsere Diskussion fort und behandeln die Erfahrungen des Teams um Anja Stolz im Hinblick auf die Digitalisierung. Welche Lehren hat es daraus
In the extended enterprise, data integration challenges abound. David Loshin explains.
If you grew up as a space-junkie kid like me, then you've probably been watching the news for the past few days, wondering when and where China's Tiangong 1 space station was going to fall out of orbit, and crash to Earth. According to Popular Mechanics (PM), that happened at 8:16pm
As a general rule, when SAS programmers want to manipulate data row by row, they reach for the SAS DATA step. When the computation requires column statistics, the SQL procedure is also useful. When both row and column operations are required, the SAS/IML language is a powerful addition to a
2016년 4월 유럽 일반개인정보보호법(GDPR; General Data Protection Regulation)이 채택됐을 때만해도 2018년 5월 25일 법률 시행일은 멀게만 느껴졌는데요. 23년만에 찾아온 대대적인 개편! 새로운 유럽 개인정보보호법(European data privacy laws)의 시행까지 이제 단 몇 주밖에 남지 않았습니다. 오늘은 GDPR이 무엇인지, 기업에 어떤 영향을 미치는지, 개인 정보 활용 동의를 어떻게 관리할 것인지 등에 대한 전반적인 논의부터
These days, it's all about music streaming ... You sign up for a service, you let them know your music preferences, and they create a virtual "radio station" that plays the songs you probably want to hear. But that just doesn't compare with going to a physical record store, buying
Suppose you want to find observations in multivariate data that are closest to a numerical target value. For example, for the students in the Sashelp.Class data set, you might want to find the students whose (Age, Height, Weight) values are closest to the triplet (13, 62, 100). The way to
Kim Kaluba gives examples of the benefits of data governance for data lakes.
EBA-Stresstest, TRIM-Initiative – es gibt 2018 mehr denn je dringende Gründe für die Banken, sich konsequent datenorientiert und analytisch aufzustellen und so vom Gejagten der Aufsicht zum Jäger nach mehr Wertschöpfung zu werden. Alle Banken wissen das. Die schlechte Nachricht: Die wenigsten Institute widmen sich diesem Thema ohne Wenn und
At SAS we use data to accomplish many of our everyday tasks. At SAS Books, we have now even used data to create a data-driven book, An Introduction to SAS Visual Analytics.
As the Research Triangle Park becomes more popular, we're getting a lot more traffic on the roads. And with flexible work hours, of course I try to pick a time to drive to work when there's less traffic. I recently saw a cool infographic showing the most popular times when
Das Banking verändert sich zunehmend. Das gilt ganz besonders für das Marketing. Anja Stolz, CMO bei der Commerzbank in Frankfurt, gibt im Interview einen Einblick in die Rolle des CMO bei diesem Transformationsprozess. Außerdem erklärt sie, wie wichtig die Customer Experience inzwischen als Marketing-Tool ist. Frau Stolz, welche Trends werden
You have the infrastructure, and you know that DATA step would run so much better in DS2, but it’s complicated and you don’t know how to get started. Well, if you have SAS 9.4M5, rejoice! The DStoDS2 procedure is here, and it’s a humdinger! (No, Chris, not a Hemedinger… ;-) It's
Simulation studies are used for many purposes, one of which is to examine how distributional assumptions affect the coverage probability of a confidence interval. This article describes the "zipper plot," which enables you to compare the coverage probability of a confidence interval when the data do or do not follow
We all have different learning styles. Some learn best by seeing and doing; others by listening to lectures in a traditional classroom; still others simply by diving in and asking questions along the way. Traditional face-to-face classroom instruction, real-time classes over the Internet, or self-paced instruction with exercises, SAS Education
みなさんご存知の通り、SAS Visual AnalyticsはセルフサービスBI&Analyticsツールで、ビジネスユーザー自身で簡単にレポートやダッシュボードを作成することができます。その際、標準で備わっている数多くのチャートオブジェクトを使用することができますが、お客様要件によっては、標準のチャートタイプだけでは表現できないものもあります。それに答えるためにSAS Visual Analytics 8.2(以下VA)には大きく2つの機能が用意されています。 データドリブンコンテンツ 地図上のカスタム境界線描画 1番目の「データドリブンコンテンツ」とは、サードパーティのビジュアライゼーション・ライブラリ(D3.js, C3, Google Chart Toolsなど)と連携することで、チャートタイプやビジュアルのバリエーションを大幅に拡張可能な機能ですが、 今回は、2番目の「地図上のカスタム境界線描画」機能に関してご紹介します。 VAに標準搭載のチャートオブジェクトには地図描画のための「ジオマップ」オブジェクトが含まれています。この機能を活用することで、例えば、地図上で隕石落下地点と被害の度合いを分析(図1.参照)したり、都道府県別の売上や店舗別の顧客数などをビジュアライズし、分析(図2.参照)することができます。 図1.隕石落下地点と被害の度合い分析ダッシュボード 図2.店舗別の売上と利益をバブルのサイズと色で表示 地図描画のタイプとしては、図1の「座標」、図2の「バブル」以外に「領域」を選択可能です。 「座標」とは、地図上の該当ポイントに円形や星形などのアイコンを表示するものです。 そして、「領域」では、基本的に地図上の国の境界線や、その一つ下のレベルである州や都道府県の境界線領域を描画します。例えばアメリカの州や日本の都道府県の領域を指定した値に基づき色分けして表示するものです。(図3.参照) 図3.都道府県ごとの売上分析 さらに、地図上に表示するこの「領域」をカスタムで描画することが可能で、これを「カスタム境界線(領域)」描画機能と呼んでいます。 この機能を活用することで、例えば、特定施設内の人や物の動線を描画したり、家屋ごとのソーラー発電量を実際の地図上に描画することなども可能になります。 その基本的な手順を、アメリカにあるコロラド・コンベンション・センター(以下CCC)内のミーティングフロアにある各種の会議室領域の描画を例に、以下に示します。 図4. VAレポート上に表示された完成版(部屋ごとの面積などを色分けして描画することができます) CCCのフロアレイアウト画像を入手し、市販ツールあるいはオープンソース製品を使用し、Esri shapeファイルを作成 Esri ShapeファイルをVA環境にインポート インポートしたデータに基づきカスタム境界線(領域)をレポート上に描画 1. CCCのフロアレイアウト画像を入手し、市販ツールあるいはオープンソース製品を使用し、Esri Shapeファイルを作成 この例では市販のEsri Desktopツールを使用し、CCCのサイトから入手したフロアレイアウトの画像をEsri地図上に重ね(図5.参照)、部屋の輪郭をなぞって描き(図6.参照)、結果をEsri Shapeファイルとして保存(図7.参照)します。(詳細に関しては、使用するツールのマニュアルを御覧ください。) 図5. Esri地図上のCCCのある地点の上に、CCCのフロアレイアウト画像を重ねる 図6. 部屋の輪郭をなぞって描く(描いた領域ごとにIDを設定しておきます。この例ではRoomID) 図7. 結果をEsri Shapeファイルとして保存 2. Esri ShapeファイルをVA環境にインポート VA環境に実装されているマクロ%SHPIMPRTを使用し、Esri ShapeファイルをSAS Datasetに変換(以降Shapeデータ)し、VA環境(インメモリー)にロードします。 詳細は、以下サポートサイトにあるSAS Viya管理者(Administration)マニュアルを御覧ください。 https://support.sas.com/documentation/onlinedoc/viya/index.html
Heute beschreibt CINTELLIC in einem Gastbeitrag, wie CRM durch ein Höchstmaß an Personalisierung und Automatisierung optimiert werden kann. 2018 werden sich drei spannende Megatrends im CRM weiterentwickeln: künstliche Intelligenz (KI), datengetriebene Personalisierung und Automatisierung von Kundeninteraktionen. Heutzutage entscheiden Kunden selbstbestimmt und in Realtime, wann und über welche Kanäle sie sich
In meiner Funktion als Academic Program Manager unterstütze ich Hochschulen in den Themengebieten künstliche Intelligenz (KI), Data Science und Business Analytics. Einer der am häufigsten geäußerten Wünsche ist, dass seitens SAS, Use-Cases zur Verfügung gestellt werden. Keine theoretischen Gebilde, sondern echte, reale Daten von Firmen mit einem handfesten Business-Problem, das
I often claim that the "natural syntax" of the SAS/IML language makes it easy to implement an algorithm or statistical formula as it appears in a textbook or journal. The other day I had an opportunity to test the truth of that statement. A SAS programmer wanted to implement the
Jim Harris says streaming data analytics can drive better decisions and faster adaptation to changing conditions.
올 초 애플이 미국 빅데이터 컨설팅 스타트업인 ‘실리콘 밸리 데이터 사이언스(Silicon Valley Data Science)’에서 창업자를 포함한 수십 명의 직원을 영입하며 화제를 모았습니다. 이전에는 인공지능(AI) 기반 데이터 분석 플랫폼 업체 ‘래티스(Lattice)’를 인수하고 하둡의 공동 창시자인 마이크 카파렐라를 스카웃하기도 했습니다. 구글 역시 60만 명의 데이터 과학자가 활동하는 호주 멜버른 기반의 스타트업인 ‘캐글(Kaggle)’을
Wie kann ich einem Mitarbeiter die unkomplizierte Anzeige und Bearbeitung von SAS Daten im Web-Browser ermöglichen? Diese Frage hat sich das SAS Expertenteam der mayato GmbH gestellt und den Lösungsweg in einem Whitepaper veröffentlicht. Das Whitepaper zeigt, wie mit SAS 9.4, HTML5 und JavaScript eine interaktive Web-Applikation erstellt werden kann.
Unternehmen, die Big Data nutzen wollen, um schlauer zu agieren und sich einen Wettbewerbsvorteil zu verschaffen, fangen meist bei der Modernisierung ihrer Analytics an. Schließlich verspricht eine moderne analytische Anwendung bessere Erkenntnisse und macht es möglich, neue Markttrends schneller zu erkennen. Doch mit der Implementierung einer neuen Visualisierungssoftware alleine ist
About once a month I see a question on the SAS Support Communities that involves what I like to call "computations with combinations." A typical question asks how to find k values (from a set of p values) that maximize or minimize some function, such as "I have 5 variables,
Datenmanagement ist ein alter Bekannter aus der IT – und andererseits ein neuer „Hidden Champion“ im digitalisierten Unternehmen. Warum? Weil Datenintegration und -aufbereitung einerseits eine ureigene und unverzichtbare Aufgabe der IT ist, deren Bedeutung weiter wächst. Andererseits aber stehen vor dem Hintergrund von datenbasierten Geschäftsprozessen und -modellen auch die Mitarbeiter
IBF Free Webinar The Institute of Business Forecasting is offering a free webinar on March 29, 2018: Analytically Speaking: Transforming Forecasting & Demand Planning in a New Era The webinar will be delivered by Chad Schumacher, Senior Director of Global Analytics at Kellogg's, and you can register here. From the