During the past few days, several news outlets told us that the number of illegal border crossings 'surged' in March 2018. This is a topic that interests me, therefore I wanted to see if the data supported what the news was claiming...
Trump's desire to secure the US borders is one of the things that got him elected. Thousands of people try to cross the US borders illegally (without permission/paperwork/etc), but it's difficult to get an exact number. For example...
- How do you count the ones that don't get caught?
- If you catch more people, does that mean there were more people trying to cross the border, or does that mean your guards are doing a better job and catching a higher percent of the people attempting to cross?
The hard data that's available is the number of people who get caught, therefore that's what I'll use in my analysis. I found the historical data in a pdf document, and the recent data in a Customs and Border Protection web page. With a bit of magic (aka, hard work), I got all the data into a spreadsheet, which I could then easily import into SAS. Now, let's visually analyze that data with some graphs...
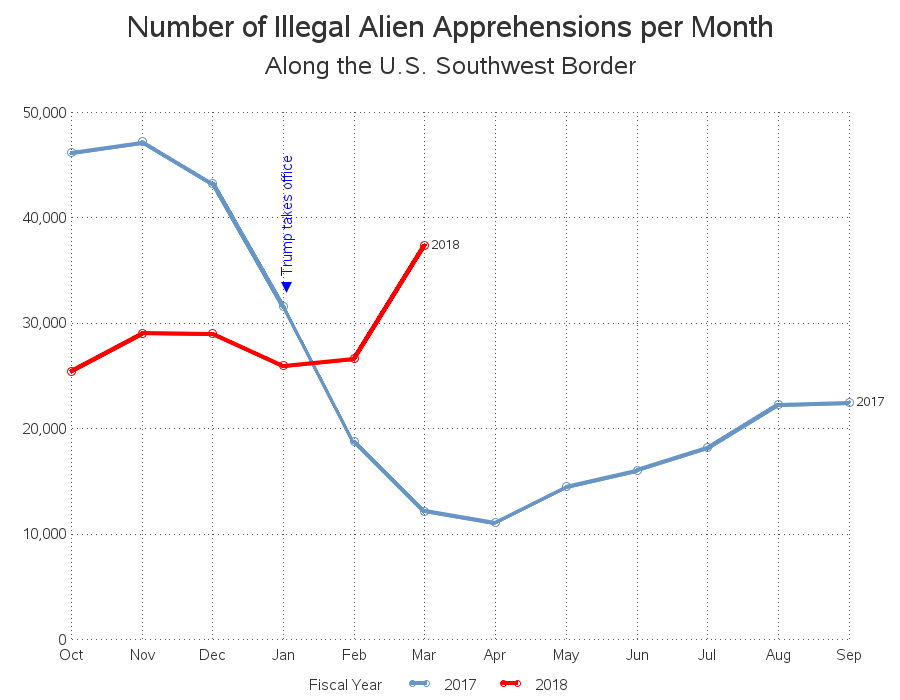
The Surge
Looking at the data for the current & previous fiscal years, the graph confirms that the 37,393 illegal alien apprehensions along the southwest US border (between US and Mexico) in March 2018 is the highest number since Trump took office in January 2017. The number apprehended in March 2018 is three times as high as the number apprehended in March 2017 (12,197). Therefore, it is true that we did have a 'surge' in March.
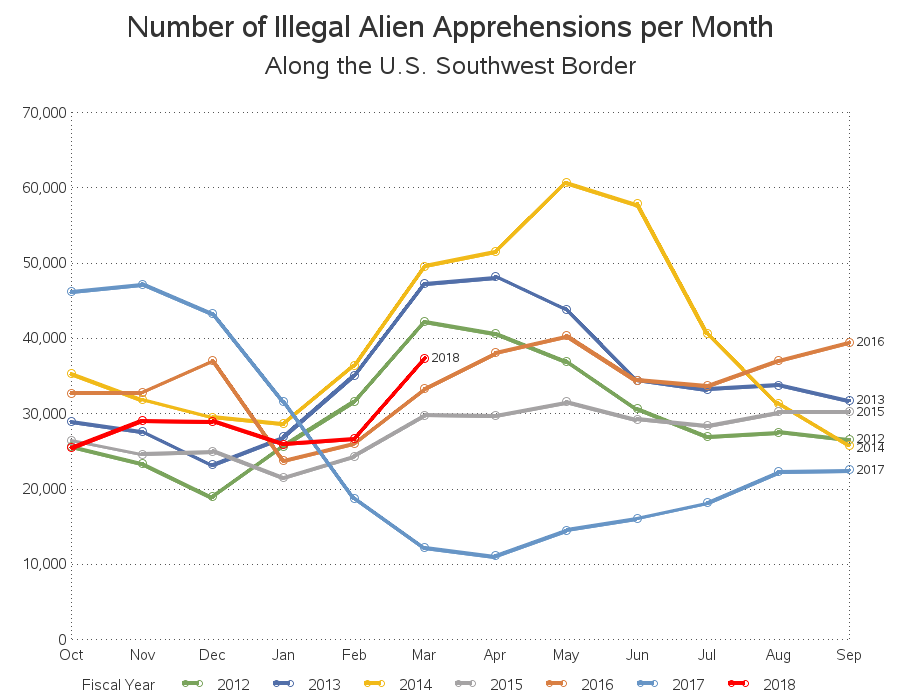
Compared to Recent Past
If you plot the data back to year 2012, it appears that 2017 (Trump's first year) is an anomaly, and the 2018 values are right in line with previous years. I'm not saying the number of apprehensions in the past few years were good/good-enough/desirable - just saying that the 2018 values are about the same as those.
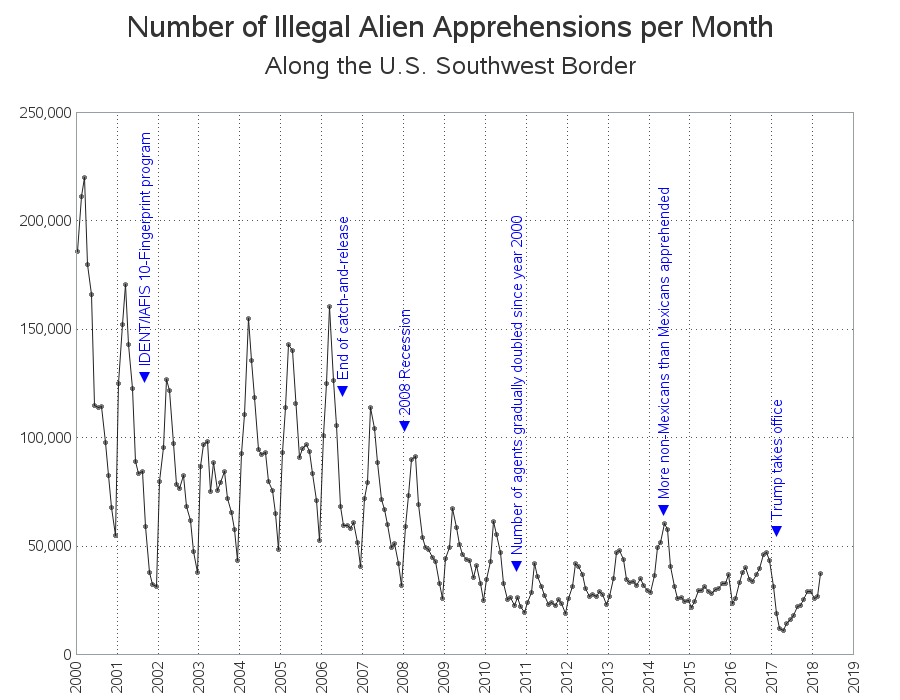
Compared to the Long-Term Trend
If we plot the values back to year 2000, the current values look very low, by comparison. But comparing current numbers to the numbers from 10-20 years ago might be comparing apples-to-oranges. For example, before fingerprint identification was started and catch-and-release policies ended, the numbers might have been very high because the same people might have been making multiple attempts (and getting caught multiple times).
So, did we really have a 'surge' in March 2018? I guess my answer would be "it depends..."
What's your opinion? Feel free to leave a comment!

3 Comments
Nice analysis! What is often more telling is a count that is adjusted for "discovery pressure". For this example, discovery pressure would be the number of active border patrols and other interdiction efforts. This data will be tough to obtain since patrol operations are surely kept confidential. However, the number of Border Agents might be readily available? Then you could analyze changes in apprehensions per agent. This measure is adjusted for increases or decreases in efforts to apprehend.
We would expect to see more apprehensions as the number of Border Patrol Agents goes up. Just as we might expect the number of apprehensions to go up with more border crossings.
The field of Sampling Statistics use some modeling techniques to estimate actual rates of events based on sampled rates of events. For this problem: How do we estimate border crossings from normalized apprehension data? For this you would need additional data to determine actual border crossings. I don't know what might be available? Some researches have shown high correlation between border crossings and economic indicators like border state economy measure and state unemployment levels.
The National Science Foundation did a study of the economic impact of border migration a few years ago. Perhaps their data is still available.
This is very interesting. It's important that you thought about the problem from a data/analytical perspective. As shown by the graph, 2017 did not follow the patterns of previous years; therefore I would exclude it from comparisons.
It's tough to say whether 2017 is an anomaly, or the "new norm".
I guess time will tell! :)