How curiosity is perfecting Texas-style barbecue: An interview with Ruben Santana

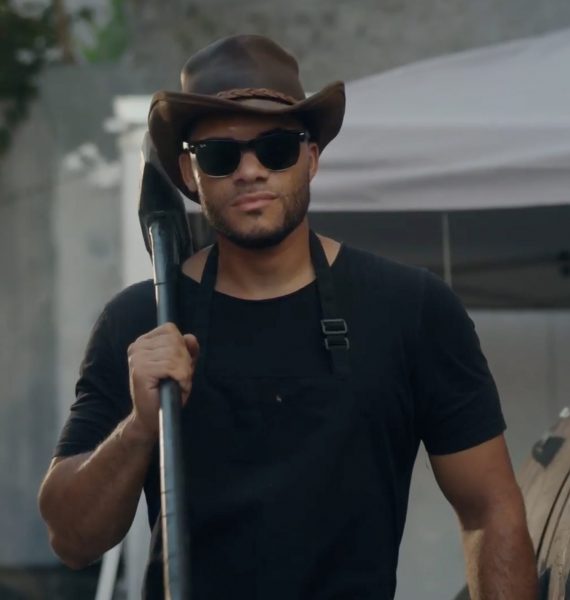
Queens, New York native Ruben Santana is the owner and pit master of Bark Barbecue, a central Texas style and Dominican Republic influenced barbecue pop-up. Santana's DR roots and love for the art and soul of central Texas style barbecue have left many of his customer's hearts and bellies full. Bark